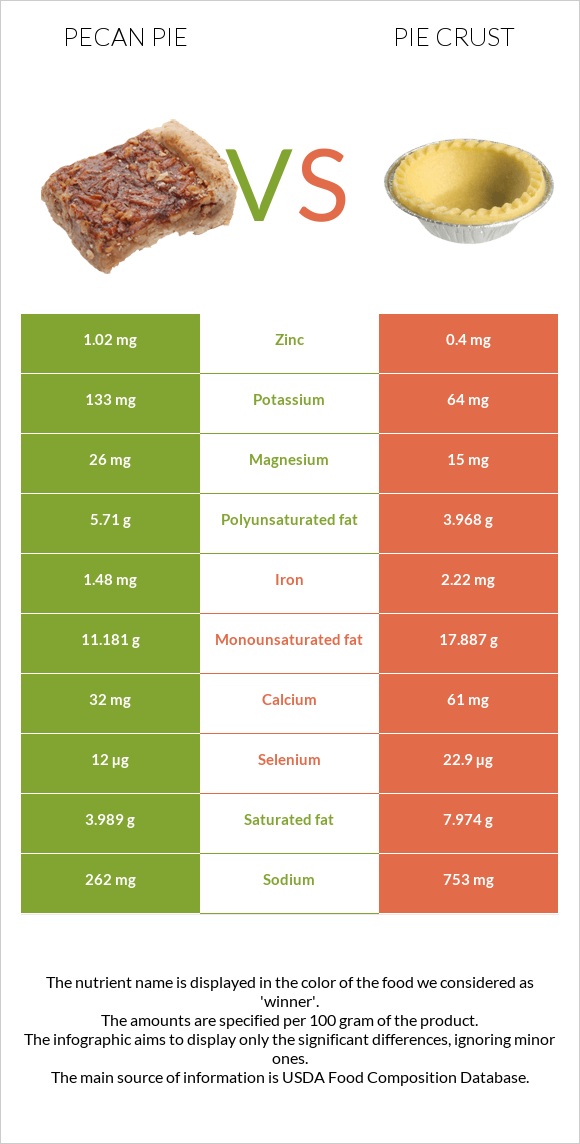
What are the differences between pecan pie and pie crust? Pecan pie is higher in manganese and copper, yet pie crust is higher in selenium, folate, vitamin B1, vitamin B3, and iron. Pecan pie's daily need coverage for cholesterol is 29% more. Pecan pie has 3 times more copper than pie crust. While pecan pie has 0.211mg of copper, pie crust has only 0.075mg. The amount of cholesterol in pie crust is lower. We used Pie, pecan, prepared from recipe and Pie crust, standard-type, dry mix types in this article.
Infographic
Mineral Comparison
Mineral comparison score is based on the number of minerals by which one or the other food is richer. The "coverage" charts below show how much of the daily needs can be covered by 300 grams of the food.
6
100 g
300 g
1 oz - 28.35g 1 piece (1/8 of 9" dia) - 122g
Magnesium
Magnesium
Calcium
Calcium
Potassium
Potassium
Iron
Iron
Copper
Copper
Zinc
Zinc
Phosphorus
Phosphorus
Sodium
Sodium
Manganese
Manganese
Selenium
Selenium
19%
9.6%
12%
56%
70%
28%
40%
34%
93%
65%
3
100 g
300 g
1 oz - 28.35g 1 package (10 oz) - 284g
Magnesium
Magnesium
Calcium
Calcium
Potassium
Potassium
Iron
Iron
Copper
Copper
Zinc
Zinc
Phosphorus
Phosphorus
Sodium
Sodium
Manganese
Manganese
Selenium
Selenium
11%
18%
5.6%
83%
25%
11%
37%
98%
41%
125%
Vitamin Comparison
Vitamin comparison score is based on the number of vitamins by which one or the other food is richer. The "coverage" charts below show how much of the daily needs can be covered by 300 grams of the food.
4
100 g
300 g
1 oz - 28.35g 1 piece (1/8 of 9" dia) - 122g
Vitamin C
Vit. C
Vitamin D
Vit. D
Vitamin A
Vit. A
Vitamin E
Vit. E
Vitamin B1
Vit. B1
Vitamin B2
Vit. B2
Vitamin B3
Vit. B3
Vitamin B5
Vit. B5
Vitamin B6
Vit. B6
Vitamin B12
Vit. B12
Vitamin K
Vit. K
Folate
Folate
0.67%
0%
27%
0%
47%
42%
16%
29%
14%
21%
0%
20%
4
100 g
300 g
1 oz - 28.35g 1 package (10 oz) - 284g
Vitamin C
Vit. C
Vitamin D
Vit. D
Vitamin A
Vit. A
Vitamin E
Vit. E
Vitamin B1
Vit. B1
Vitamin B2
Vit. B2
Vitamin B3
Vit. B3
Vitamin B5
Vit. B5
Vitamin B6
Vit. B6
Vitamin B12
Vit. B12
Vitamin K
Vit. K
Folate
Folate
0%
0%
0%
0%
98%
49%
51%
16%
15%
0%
0%
78%
All nutrients comparison - raw data values
Nutrient
DV% diff.
Cholesterol
87mg
0mg
29%
Sodium
262mg
753mg
21%
Selenium
12µg
22.9µg
20%
Folate
26µg
104µg
20%
Saturated fat
3.989g
7.974g
18%
Manganese
0.712mg
0.315mg
17%
Vitamin B1
0.188mg
0.392mg
17%
Monounsaturated fat
11.181g
17.887g
17%
Copper
0.211mg
0.075mg
15%
Fats
22.2g
31.4g
14%
Vitamin B3
0.847mg
2.727mg
12%
Polyunsaturated fat
5.71g
3.968g
12%
Iron
1.48mg
2.22mg
9%
Vitamin A
82µg
0µg
9%
Vitamin B12
0.17µg
0µg
7%
Zinc
1.02mg
0.4mg
6%
Calories
412kcal
518kcal
5%
Protein
4.9g
6.9g
4%
Vitamin B5
0.479mg
0.268mg
4%
Magnesium
26mg
15mg
3%
Calcium
32mg
61mg
3%
Vitamin B2
0.18mg
0.213mg
3%
Potassium
133mg
64mg
2%
Phosphorus
94mg
86mg
1%
Protein per 100 calories
1.2g
1.3g
N/A
Calories per 10 g protein
841kcal
751kcal
N/A
Weight per 100 calories
24g
19g
N/A
Unsaturated / Saturated Fat ratio
4.2
2.7
N/A
Vitamin C
0.2mg
0mg
0%
Net carbs
52.2g
52.1g
N/A
Carbs
52.2g
52.1g
0%
Vitamin B6
0.06mg
0.064mg
0%
Tryptophan
0.069mg
0.08mg
0%
Threonine
0.189mg
0.184mg
0%
Isoleucine
0.223mg
0.255mg
0%
Leucine
0.372mg
0.476mg
0%
Lysine
0.248mg
0.133mg
0%
Methionine
0.125mg
0.121mg
0%
Phenylalanine
0.25mg
0.339mg
0%
Valine
0.255mg
0.289mg
0%
Histidine
0.116mg
0.146mg
0%
Omega-3 - EPA
0.001g
0g
N/A
Omega-3 - DHA
0.008g
0g
N/A
Macronutrient Comparison
Macronutrient breakdown side-by-side comparison
2
5%
22%
52%
20%
Protein:
4.9 g
Fats:
22.2 g
Carbs:
52.2 g
Water:
19.5 g
Other:
1.2 g
3
7%
31%
52%
8%
2%
Protein:
6.9 g
Fats:
31.4 g
Carbs:
52.1 g
Water:
7.6 g
Other:
2 g
Contains
more
Water Water
+156.6%
Contains
more
Protein Protein
+40.8%
Contains
more
Fats Fats
+41.4%
Contains
more
Other Other
+66.7%
Fat Type Comparison
Fat type breakdown side-by-side comparison
2
19%
54%
27%
Saturated fat:
Sat. Fat
3.989 g
Monounsaturated fat:
Mono. Fat
11.181 g
Polyunsaturated fat:
Poly. Fat
5.71 g
1
27%
60%
13%
Saturated fat:
Sat. Fat
7.974 g
Monounsaturated fat:
Mono. Fat
17.887 g
Polyunsaturated fat:
Poly. Fat
3.968 g
Contains
less
Sat. Fat Saturated fat
-50%
Contains
more
Poly. Fat Polyunsaturated fat
+43.9%
Contains
more
Mono. Fat Monounsaturated fat
+60%