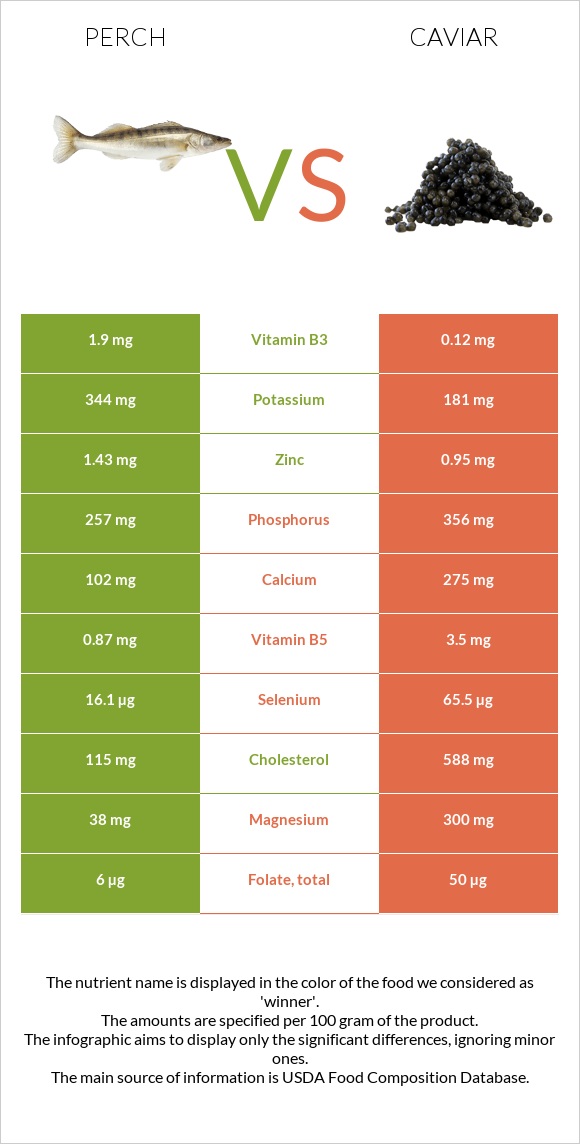
Summary of differences between perch and caviar Perch has more manganese, while caviar has more vitamin B12, iron, selenium, magnesium, vitamin B5, and vitamin B2. Caviar covers your daily need for vitamin B12, 742% more than perch. Perch contains 18 times more manganese than caviar. While perch contains 0.9mg of manganese, caviar contains only 0.05mg. The amount of cholesterol in perch is lower. These are the specific foods used in this comparison Fish, perch, mixed species, cooked, dry heat and Fish, caviar, black, and red, granular .
Infographic
Mineral Comparison
Mineral comparison score is based on the number of minerals by which one or the other food is richer. The "coverage" charts below show how much of the daily needs can be covered by 300 grams of the food.
5
100 g
300 g
1 fillet - 46g 3 oz - 85g
Magnesium
Magnesium
Calcium
Calcium
Potassium
Potassium
Iron
Iron
Copper
Copper
Zinc
Zinc
Phosphorus
Phosphorus
Sodium
Sodium
Manganese
Manganese
Selenium
Selenium
27%
31%
30%
44%
64%
39%
110%
10%
117%
88%
5
100 g
300 g
1 tbsp - 16g 1 oz - 28.35g
Magnesium
Magnesium
Calcium
Calcium
Potassium
Potassium
Iron
Iron
Copper
Copper
Zinc
Zinc
Phosphorus
Phosphorus
Sodium
Sodium
Manganese
Manganese
Selenium
Selenium
214%
83%
16%
446%
37%
26%
153%
196%
6.5%
357%
Vitamin Comparison
Vitamin comparison score is based on the number of vitamins by which one or the other food is richer. The "coverage" charts below show how much of the daily needs can be covered by 300 grams of the food.
2
100 g
300 g
1 fillet - 46g 3 oz - 85g
Vitamin C
Vit. C
Vitamin D
Vit. D
Vitamin A
Vit. A
Vitamin E
Vit. E
Vitamin B1
Vit. B1
Vitamin B2
Vit. B2
Vitamin B3
Vit. B3
Vitamin B5
Vit. B5
Vitamin B6
Vit. B6
Vitamin B12
Vit. B12
Vitamin K
Vit. K
Folate
Folate
5.7%
0%
3.3%
0%
20%
28%
36%
52%
32%
275%
0%
4.5%
10
100 g
300 g
1 tbsp - 16g 1 oz - 28.35g
Vitamin C
Vit. C
Vitamin D
Vit. D
Vitamin A
Vit. A
Vitamin E
Vit. E
Vitamin B1
Vit. B1
Vitamin B2
Vit. B2
Vitamin B3
Vit. B3
Vitamin B5
Vit. B5
Vitamin B6
Vit. B6
Vitamin B12
Vit. B12
Vitamin K
Vit. K
Folate
Folate
0%
44%
90%
38%
48%
143%
2.3%
210%
74%
2500%
1.5%
38%
All nutrients comparison - raw data values
Nutrient
DV% diff.
Vitamin B12
2.2µg
20µg
742%
Cholesterol
115mg
588mg
158%
Iron
1.16mg
11.88mg
134%
Selenium
16.1µg
65.5µg
90%
Choline
490.9mg
89%
Magnesium
38mg
300mg
62%
Sodium
79mg
1500mg
62%
Vitamin B5
0.87mg
3.5mg
53%
Polyunsaturated fat
0.472g
7.405g
46%
Vitamin B2
0.12mg
0.62mg
38%
Manganese
0.9mg
0.05mg
37%
Vitamin A
10µg
271µg
29%
Fats
1.18g
17.9g
26%
Calcium
102mg
275mg
17%
Saturated fat
0.237g
4.06g
17%
Vitamin D*
117 IU
15%
Vitamin D
2.9µg
15%
Phosphorus
257mg
356mg
14%
Vitamin B6
0.14mg
0.32mg
14%
Vitamin E
1.89mg
13%
Vitamin B3
1.9mg
0.12mg
11%
Folate
6µg
50µg
11%
Monounsaturated fat
0.195g
4.631g
11%
Copper
0.192mg
0.11mg
9%
Vitamin B1
0.08mg
0.19mg
9%
Calories
117kcal
264kcal
7%
Potassium
344mg
181mg
5%
Zinc
1.43mg
0.95mg
4%
Vitamin C
1.7mg
0mg
2%
Protein
24.86g
24.6g
1%
Carbs
0g
4g
1%
Vitamin K
0.6µg
1%
Protein per 100 calories
21g
9.3g
N/A
Calories per 10 g protein
47kcal
107kcal
N/A
Weight per 100 calories
85g
38g
N/A
Unsaturated / Saturated Fat ratio
2.8
3
N/A
Net carbs
0g
4g
N/A
Tryptophan
0.278mg
0.323mg
0%
Threonine
1.09mg
1.263mg
0%
Isoleucine
1.145mg
1.035mg
0%
Leucine
2.02mg
2.133mg
0%
Lysine
2.283mg
1.834mg
0%
Methionine
0.736mg
0.646mg
0%
Phenylalanine
0.97mg
1.071mg
0%
Valine
1.281mg
1.263mg
0%
Histidine
0.732mg
0.649mg
0%
Omega-3 - EPA
0.101g
2.741g
N/A
Omega-3 - DHA
0.223g
3.8g
N/A
Omega-3 - DPA
0.036g
0.229g
N/A
Macronutrient Comparison
Macronutrient breakdown side-by-side comparison
2
25%
73%
Protein:
24.86 g
Fats:
1.18 g
Carbs:
0 g
Water:
73.25 g
Other:
0.71 g
3
25%
18%
4%
48%
6%
Protein:
24.6 g
Fats:
17.9 g
Carbs:
4 g
Water:
47.5 g
Other:
6 g
Contains
more
Water Water
+54.2%
Contains
more
Fats Fats
+1416.9%
Contains
more
Carbs Carbs
+∞%
Contains
more
Other Other
+745.1%
Fat Type Comparison
Fat type breakdown side-by-side comparison
1
26%
22%
52%
Saturated fat:
Sat. Fat
0.237 g
Monounsaturated fat:
Mono. Fat
0.195 g
Polyunsaturated fat:
Poly. Fat
0.472 g
2
25%
29%
46%
Saturated fat:
Sat. Fat
4.06 g
Monounsaturated fat:
Mono. Fat
4.631 g
Polyunsaturated fat:
Poly. Fat
7.405 g
Contains
less
Sat. Fat Saturated fat
-94.2%
Contains
more
Mono. Fat Monounsaturated fat
+2274.9%
Contains
more
Poly. Fat Polyunsaturated fat
+1468.9%