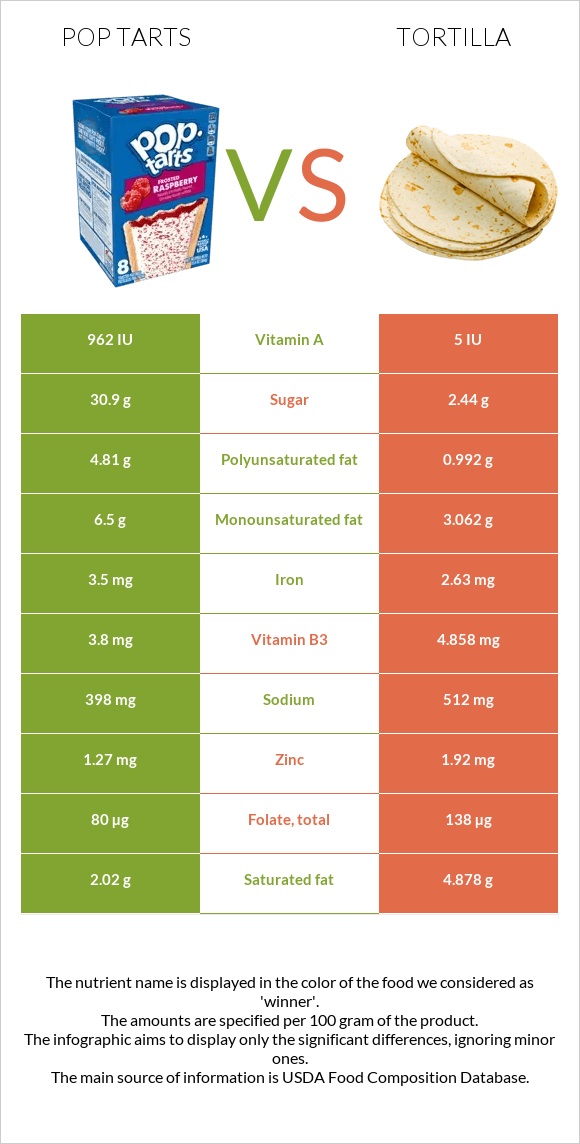
Differences between pop tarts and tortillas Pop tarts have more vitamin A and iron, while tortillas have more vitamin B1, phosphorus, fiber, calcium, magnesium, folate, and copper. Tortillas' daily need coverage for vitamin B1 is 44% higher. Tortillas contain 192 times less vitamin A than pop tarts. Pop tarts contain 962 IU of vitamin A, while tortillas contain 5 IU. The amount of saturated fat in pop tarts is lower. Tortillas have a lower glycemic index. The glycemic index of tortillas is 52, while the glycemic index of pop tarts is 70. The food types used in this comparison are Toaster Pastries, KELLOGG, KELLOGG'S POP TARTS, Blueberry and Tortillas, ready-to-bake or -fry, whole wheat .
Infographic
Mineral Comparison
Mineral comparison score is based on the number of minerals by which one or the other food is richer. The "coverage" charts below show how much of the daily needs can be covered by 300 grams of the food.
2
100 g
300 g
1 pastry - 52g
Magnesium
Magnesium
Calcium
Calcium
Potassium
Potassium
Iron
Iron
Copper
Copper
Zinc
Zinc
Phosphorus
Phosphorus
Sodium
Sodium
Manganese
Manganese
Selenium
Selenium
11%
7.2%
8.4%
131%
50%
35%
38%
52%
0%
0%
7
100 g
300 g
1 tortilla 1 serving - 41g
Magnesium
Magnesium
Calcium
Calcium
Potassium
Potassium
Iron
Iron
Copper
Copper
Zinc
Zinc
Phosphorus
Phosphorus
Sodium
Sodium
Manganese
Manganese
Selenium
Selenium
61%
73%
23%
99%
89%
52%
148%
67%
0%
202%
Vitamin Comparison
Vitamin comparison score is based on the number of vitamins by which one or the other food is richer. The "coverage" charts below show how much of the daily needs can be covered by 300 grams of the food.
3
100 g
300 g
1 pastry - 52g
Vitamin C
Vit. C
Vitamin D
Vit. D
Vitamin A
Vit. A
Vitamin E
Vit. E
Vitamin B1
Vit. B1
Vitamin B2
Vit. B2
Vitamin B3
Vit. B3
Vitamin B5
Vit. B5
Vitamin B6
Vit. B6
Vitamin B12
Vit. B12
Vitamin K
Vit. K
Folate
Folate
0%
0%
96%
0%
73%
76%
71%
0%
88%
0%
0%
60%
5
100 g
300 g
1 tortilla 1 serving - 41g
Vitamin C
Vit. C
Vitamin D
Vit. D
Vitamin A
Vit. A
Vitamin E
Vit. E
Vitamin B1
Vit. B1
Vitamin B2
Vit. B2
Vitamin B3
Vit. B3
Vitamin B5
Vit. B5
Vitamin B6
Vit. B6
Vitamin B12
Vit. B12
Vitamin K
Vit. K
Folate
Folate
0%
0%
0%
18%
206%
67%
91%
0%
72%
0%
11%
104%
All nutrients comparison - raw data values
Nutrient
DV% diff.
Selenium
37µg
67%
Vitamin B1
0.29mg
0.823mg
44%
Phosphorus
88mg
346mg
37%
Fiber
1.1g
9.8g
35%
Vitamin A
289µg
0µg
32%
Polyunsaturated fat
4.81g
0.992g
25%
Calcium
24mg
244mg
22%
Magnesium
16mg
85mg
16%
Folate
80µg
138µg
15%
Copper
0.15mg
0.266mg
13%
Saturated fat
2.02g
4.878g
13%
Iron
3.5mg
2.63mg
11%
Protein
4.6g
9.76g
10%
Monounsaturated fat
6.5g
3.062g
9%
Carbs
68.41g
45.89g
8%
Vitamin B3
3.8mg
4.858mg
7%
Zinc
1.27mg
1.92mg
6%
Vitamin E
0.9mg
6%
Calories
412kcal
310kcal
5%
Fats
13.3g
9.76g
5%
Potassium
95mg
262mg
5%
Sodium
398mg
512mg
5%
Vitamin B6
0.38mg
0.312mg
5%
Vitamin K
4.5µg
4%
Choline
20mg
4%
Vitamin B2
0.33mg
0.289mg
3%
Protein per 100 calories
1.1g
3.1g
N/A
Calories per 10 g protein
896kcal
318kcal
N/A
Weight per 100 calories
24g
32g
N/A
Unsaturated / Saturated Fat ratio
5.6
0.83
N/A
Net carbs
67.31g
36.09g
N/A
Sugar
30.9g
2.44g
N/A
Tryptophan
0.129mg
0%
Threonine
0.312mg
0%
Isoleucine
0.353mg
0%
Leucine
0.671mg
0%
Lysine
0.37mg
0%
Methionine
0.163mg
0%
Phenylalanine
0.488mg
0%
Valine
0.444mg
0%
Histidine
0.255mg
0%
Macronutrient Comparison
Macronutrient breakdown side-by-side comparison
2
5%
13%
68%
13%
Protein:
4.6 g
Fats:
13.3 g
Carbs:
68.41 g
Water:
12.5 g
Other:
1.19 g
3
10%
10%
46%
30%
4%
Protein:
9.76 g
Fats:
9.76 g
Carbs:
45.89 g
Water:
30.15 g
Other:
4.44 g
Contains
more
Fats Fats
+36.3%
Contains
more
Carbs Carbs
+49.1%
Contains
more
Protein Protein
+112.2%
Contains
more
Water Water
+141.2%
Contains
more
Other Other
+273.1%
Fat Type Comparison
Fat type breakdown side-by-side comparison
3
15%
49%
36%
Saturated fat:
Sat. Fat
2.02 g
Monounsaturated fat:
Mono. Fat
6.5 g
Polyunsaturated fat:
Poly. Fat
4.81 g
0
55%
34%
11%
Saturated fat:
Sat. Fat
4.878 g
Monounsaturated fat:
Mono. Fat
3.062 g
Polyunsaturated fat:
Poly. Fat
0.992 g
Contains
less
Sat. Fat Saturated fat
-58.6%
Contains
more
Mono. Fat Monounsaturated fat
+112.3%
Contains
more
Poly. Fat Polyunsaturated fat
+384.9%