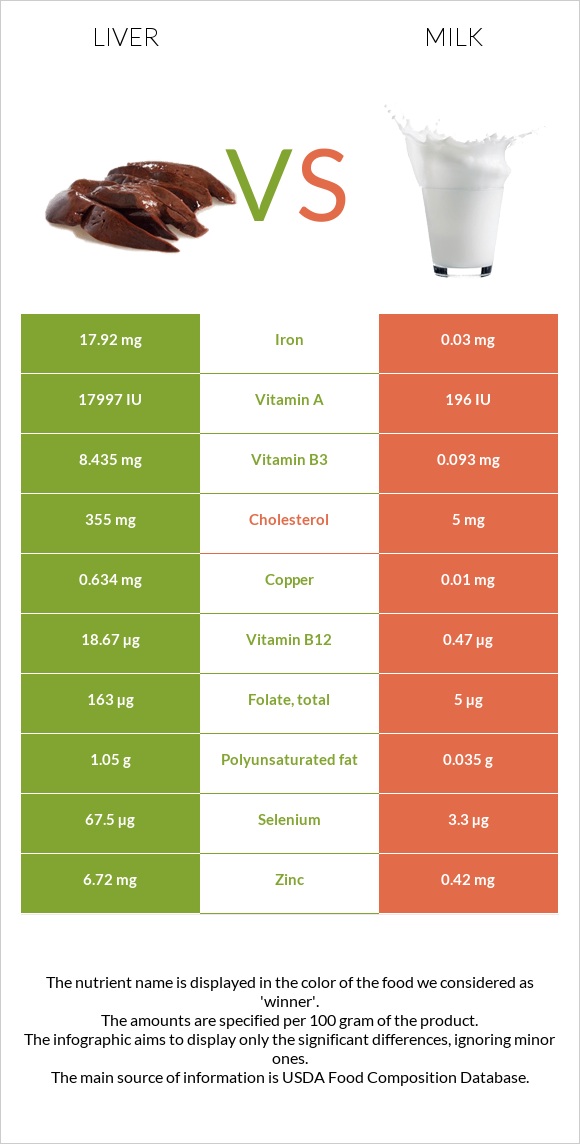
Summary of differences between liver and milk The amount of vitamin B12, vitamin A, iron, vitamin B2, selenium, vitamin B5, copper, zinc, and vitamin B3 in liver is higher than in milk. Liver covers your daily need for vitamin B12, 758% more than milk. Liver contains 597 times more iron than milk. While liver contains 17.92mg of iron, milk contains only 0.03mg. The amount of cholesterol in milk is lower. Liver has a lower glycemic index. The glycemic index of liver is 0, while the glycemic index of milk is 31. These are the specific foods used in this comparison Pork, fresh, variety meats, and by-products, liver, cooked, braised and Milk, lowfat, fluid, 1% milkfat, with added vitamin A and vitamin D .
Infographic
Mineral Comparison
Mineral comparison score is based on the number of minerals by which one or the other food is richer. The "coverage" charts below show how much of the daily needs can be covered by 300 grams of the food.
7
100 g
300 g
3 oz - 85g
Magnesium
Magnesium
Calcium
Calcium
Potassium
Potassium
Iron
Iron
Copper
Copper
Zinc
Zinc
Phosphorus
Phosphorus
Sodium
Sodium
Manganese
Manganese
Selenium
Selenium
10%
3%
13%
672%
211%
183%
103%
6.4%
39%
368%
2
100 g
300 g
1 fl oz - 30.5g 1 cup - 244g 1 quart - 976g
Magnesium
Magnesium
Calcium
Calcium
Potassium
Potassium
Iron
Iron
Copper
Copper
Zinc
Zinc
Phosphorus
Phosphorus
Sodium
Sodium
Manganese
Manganese
Selenium
Selenium
7.9%
38%
13%
1.1%
3.3%
11%
41%
5.7%
0.39%
18%
Vitamin Comparison
Vitamin comparison score is based on the number of vitamins by which one or the other food is richer. The "coverage" charts below show how much of the daily needs can be covered by 300 grams of the food.
9
100 g
300 g
3 oz - 85g
Vitamin C
Vit. C
Vitamin D
Vit. D
Vitamin A
Vit. A
Vitamin E
Vit. E
Vitamin B1
Vit. B1
Vitamin B2
Vit. B2
Vitamin B3
Vit. B3
Vitamin B5
Vit. B5
Vitamin B6
Vit. B6
Vitamin B12
Vit. B12
Vitamin K
Vit. K
Folate
Folate
79%
0%
1802%
0%
65%
507%
158%
286%
132%
2334%
0%
122%
3
100 g
300 g
1 fl oz - 30.5g 1 cup - 244g 1 quart - 976g
Vitamin C
Vit. C
Vitamin D
Vit. D
Vitamin A
Vit. A
Vitamin E
Vit. E
Vitamin B1
Vit. B1
Vitamin B2
Vit. B2
Vitamin B3
Vit. B3
Vitamin B5
Vit. B5
Vitamin B6
Vit. B6
Vitamin B12
Vit. B12
Vitamin K
Vit. K
Folate
Folate
0%
18%
19%
0.2%
5%
43%
1.7%
22%
8.5%
59%
0.25%
3.8%
All nutrients comparison - raw data values
Nutrient
DV% diff.
Vitamin B12
18.67µg
0.47µg
758%
Vitamin A
5405µg
58µg
594%
Iron
17.92mg
0.03mg
224%
Vitamin B2
2.196mg
0.185mg
155%
Cholesterol
355mg
5mg
117%
Selenium
67.5µg
3.3µg
117%
Vitamin B5
4.774mg
0.361mg
88%
Copper
0.634mg
0.01mg
69%
Zinc
6.72mg
0.42mg
57%
Vitamin B3
8.435mg
0.093mg
52%
Protein
26.02g
3.37g
45%
Vitamin B6
0.57mg
0.037mg
41%
Folate
163µg
5µg
40%
Vitamin C
23.6mg
0mg
26%
Phosphorus
241mg
95mg
21%
Vitamin B1
0.258mg
0.02mg
20%
Manganese
0.3mg
0.003mg
13%
Calcium
10mg
125mg
12%
Polyunsaturated fat
1.05g
0.035g
7%
Calories
165kcal
42kcal
6%
Vitamin D*
48 IU
6%
Vitamin D
1.2µg
6%
Fats
4.4g
0.97g
5%
Saturated fat
1.41g
0.633g
4%
Choline
17.7mg
3%
Magnesium
14mg
11mg
1%
Monounsaturated fat
0.63g
0.277g
1%
Protein per 100 calories
16g
8g
N/A
Calories per 10 g protein
63kcal
125kcal
N/A
Weight per 100 calories
61g
238g
N/A
Unsaturated / Saturated Fat ratio
1.2
0.49
N/A
Net carbs
3.76g
4.99g
N/A
Carbs
3.76g
4.99g
0%
Potassium
150mg
150mg
0%
Sugar
5.2g
N/A
Sodium
49mg
44mg
0%
Vitamin E
0.01mg
0%
Vitamin K
0.1µg
0%
Tryptophan
0.366mg
0.043mg
0%
Threonine
1.107mg
0.143mg
0%
Isoleucine
1.32mg
0.174mg
0%
Leucine
2.319mg
0.319mg
0%
Lysine
2.007mg
0.282mg
0%
Methionine
0.645mg
0.088mg
0%
Phenylalanine
1.274mg
0.174mg
0%
Valine
1.607mg
0.22mg
0%
Histidine
0.708mg
0.101mg
0%
Omega-3 - DHA
0.03g
0g
N/A
Omega-3 - ALA
0.004g
N/A
Omega-3 - DPA
0.04g
0g
N/A
Omega-6 - Linoleic acid
0.027g
N/A
Macronutrient Comparison
Macronutrient breakdown side-by-side comparison
3
26%
4%
4%
64%
Protein:
26.02 g
Fats:
4.4 g
Carbs:
3.76 g
Water:
64.32 g
Other:
1.5 g
2
3%
5%
90%
Protein:
3.37 g
Fats:
0.97 g
Carbs:
4.99 g
Water:
89.92 g
Other:
0.75 g
Contains
more
Protein Protein
+672.1%
Contains
more
Fats Fats
+353.6%
Contains
more
Other Other
+100%
Contains
more
Carbs Carbs
+32.7%
Contains
more
Water Water
+39.8%
Fat Type Comparison
Fat type breakdown side-by-side comparison
2
46%
20%
34%
Saturated fat:
Sat. Fat
1.41 g
Monounsaturated fat:
Mono. Fat
0.63 g
Polyunsaturated fat:
Poly. Fat
1.05 g
1
67%
29%
4%
Saturated fat:
Sat. Fat
0.633 g
Monounsaturated fat:
Mono. Fat
0.277 g
Polyunsaturated fat:
Poly. Fat
0.035 g
Contains
more
Mono. Fat Monounsaturated fat
+127.4%
Contains
more
Poly. Fat Polyunsaturated fat
+2900%
Contains
less
Sat. Fat Saturated fat
-55.1%