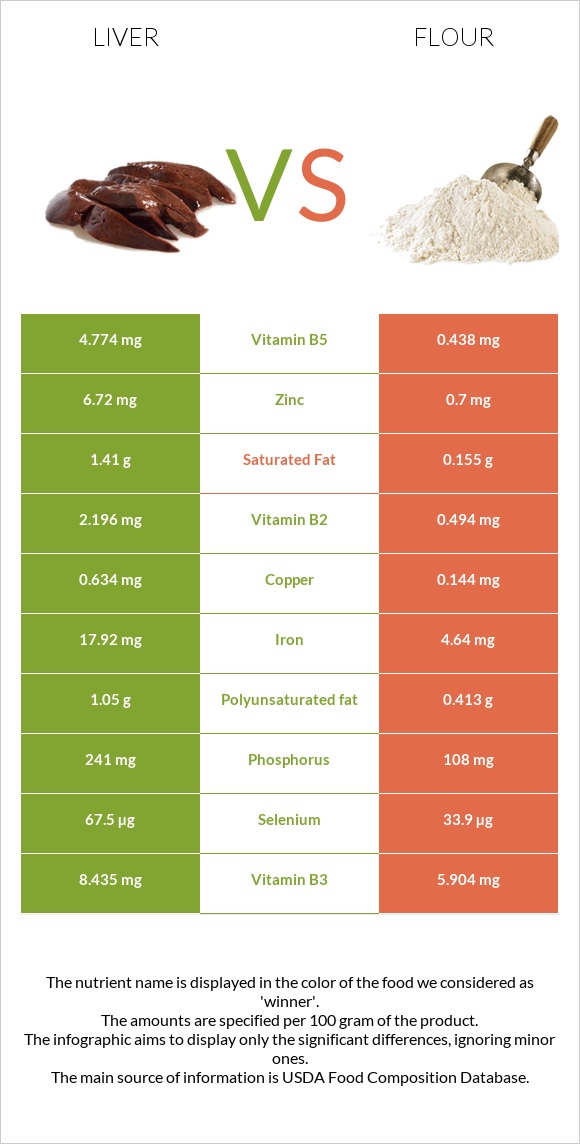
Important differences between liver and flour Liver has more vitamin B12, vitamin A, iron, vitamin B2, vitamin B5, selenium, zinc, and copper; however, flour is richer in vitamin B1. Liver's daily need coverage for vitamin B12 is 778% more. Flour contains less cholesterol. Flour has a higher glycemic index. The glycemic index of flour is 72, while the glycemic index of liver is 0. The food varieties used in the comparison are Pork, fresh, variety meats, and by-products, liver, cooked, braised and Wheat flour, white, all-purpose, enriched, bleached .
Infographic
Mineral Comparison
Mineral comparison score is based on the number of minerals by which one or the other food is richer. The "coverage" charts below show how much of the daily needs can be covered by 300 grams of the food.
6
100 g
300 g
3 oz - 85g
Magnesium
Magnesium
Calcium
Calcium
Potassium
Potassium
Iron
Iron
Copper
Copper
Zinc
Zinc
Phosphorus
Phosphorus
Sodium
Sodium
Manganese
Manganese
Selenium
Selenium
10%
3%
13%
672%
211%
183%
103%
6.4%
39%
368%
4
100 g
300 g
1 cup - 125g
Magnesium
Magnesium
Calcium
Calcium
Potassium
Potassium
Iron
Iron
Copper
Copper
Zinc
Zinc
Phosphorus
Phosphorus
Sodium
Sodium
Manganese
Manganese
Selenium
Selenium
16%
4.5%
9.4%
174%
48%
19%
46%
0.26%
89%
185%
Vitamin Comparison
Vitamin comparison score is based on the number of vitamins by which one or the other food is richer. The "coverage" charts below show how much of the daily needs can be covered by 300 grams of the food.
7
100 g
300 g
3 oz - 85g
Vitamin C
Vit. C
Vitamin D
Vit. D
Vitamin A
Vit. A
Vitamin E
Vit. E
Vitamin B1
Vit. B1
Vitamin B2
Vit. B2
Vitamin B3
Vit. B3
Vitamin B5
Vit. B5
Vitamin B6
Vit. B6
Vitamin B12
Vit. B12
Vitamin K
Vit. K
Folate
Folate
79%
0%
1802%
0%
65%
507%
158%
286%
132%
2334%
0%
122%
4
100 g
300 g
1 cup - 125g
Vitamin C
Vit. C
Vitamin D
Vit. D
Vitamin A
Vit. A
Vitamin E
Vit. E
Vitamin B1
Vit. B1
Vitamin B2
Vit. B2
Vitamin B3
Vit. B3
Vitamin B5
Vit. B5
Vitamin B6
Vit. B6
Vitamin B12
Vit. B12
Vitamin K
Vit. K
Folate
Folate
0%
0%
0%
1.2%
196%
114%
111%
26%
10%
0%
0.75%
137%
All nutrients comparison - raw data values
Nutrient
DV% diff.
Vitamin B12
18.67µg
0µg
778%
Vitamin A
5405µg
0µg
601%
Iron
17.92mg
4.64mg
166%
Vitamin B2
2.196mg
0.494mg
131%
Cholesterol
355mg
0mg
118%
Vitamin B5
4.774mg
0.438mg
87%
Selenium
67.5µg
33.9µg
61%
Zinc
6.72mg
0.7mg
55%
Copper
0.634mg
0.144mg
54%
Vitamin B1
0.258mg
0.785mg
44%
Vitamin B6
0.57mg
0.044mg
40%
Protein
26.02g
10.33g
31%
Vitamin C
23.6mg
0mg
26%
Carbs
3.76g
76.31g
24%
Phosphorus
241mg
108mg
19%
Manganese
0.3mg
0.682mg
17%
Vitamin B3
8.435mg
5.904mg
16%
Fiber
0g
2.7g
11%
Calories
165kcal
364kcal
10%
Saturated fat
1.41g
0.155g
6%
Fats
4.4g
0.98g
5%
Folate
163µg
183µg
5%
Polyunsaturated fat
1.05g
0.413g
4%
Magnesium
14mg
22mg
2%
Sodium
49mg
2mg
2%
Choline
10.4mg
2%
Calcium
10mg
15mg
1%
Potassium
150mg
107mg
1%
Monounsaturated fat
0.63g
0.087g
1%
Protein per 100 calories
16g
2.8g
N/A
Calories per 10 g protein
63kcal
352kcal
N/A
Weight per 100 calories
61g
27g
N/A
Unsaturated / Saturated Fat ratio
1.2
3.2
N/A
Net carbs
3.76g
73.61g
N/A
Sugar
0.27g
N/A
Vitamin E
0.06mg
0%
Vitamin K
0.3µg
0%
Tryptophan
0.366mg
0.127mg
0%
Threonine
1.107mg
0.281mg
0%
Isoleucine
1.32mg
0.357mg
0%
Leucine
2.319mg
0.71mg
0%
Lysine
2.007mg
0.228mg
0%
Methionine
0.645mg
0.183mg
0%
Phenylalanine
1.274mg
0.52mg
0%
Valine
1.607mg
0.415mg
0%
Histidine
0.708mg
0.23mg
0%
Omega-3 - DHA
0.03g
0g
N/A
Omega-3 - DPA
0.04g
0g
N/A
Macronutrient Comparison
Macronutrient breakdown side-by-side comparison
4
26%
4%
4%
64%
Protein:
26.02 g
Fats:
4.4 g
Carbs:
3.76 g
Water:
64.32 g
Other:
1.5 g
1
10%
76%
12%
Protein:
10.33 g
Fats:
0.98 g
Carbs:
76.31 g
Water:
11.92 g
Other:
0.46 g
Contains
more
Protein Protein
+151.9%
Contains
more
Fats Fats
+349%
Contains
more
Water Water
+439.6%
Contains
more
Other Other
+226.1%
Contains
more
Carbs Carbs
+1929.5%
Fat Type Comparison
Fat type breakdown side-by-side comparison
2
46%
20%
34%
Saturated fat:
Sat. Fat
1.41 g
Monounsaturated fat:
Mono. Fat
0.63 g
Polyunsaturated fat:
Poly. Fat
1.05 g
1
24%
13%
63%
Saturated fat:
Sat. Fat
0.155 g
Monounsaturated fat:
Mono. Fat
0.087 g
Polyunsaturated fat:
Poly. Fat
0.413 g
Contains
more
Mono. Fat Monounsaturated fat
+624.1%
Contains
more
Poly. Fat Polyunsaturated fat
+154.2%
Contains
less
Sat. Fat Saturated fat
-89%