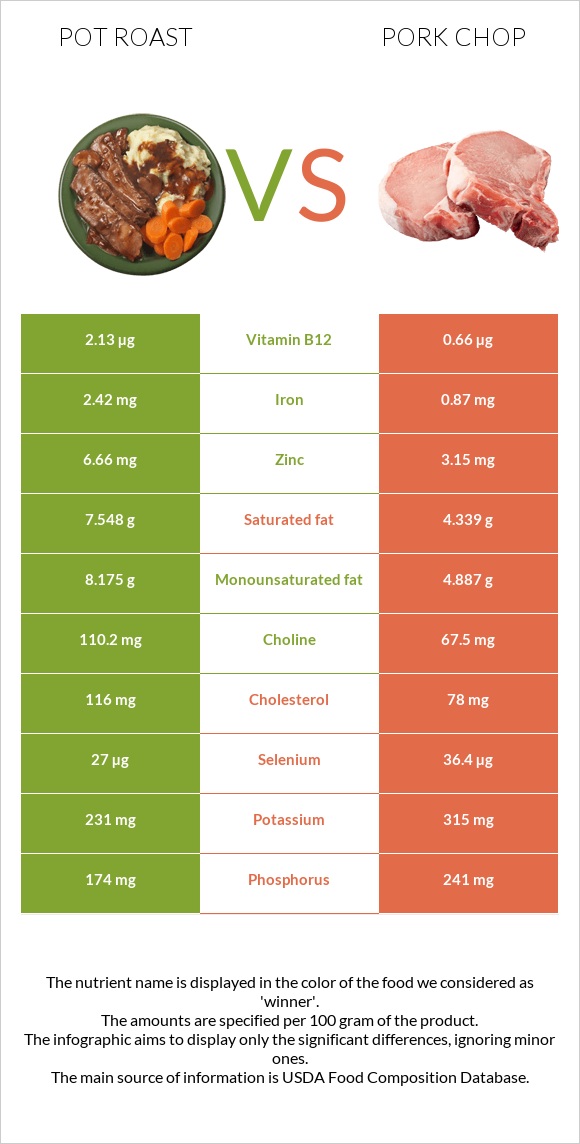
Summary of differences between pot roast and pork chop Pot roast has more vitamin B12, zinc, and iron, while pork chop has more vitamin B1, vitamin B3, selenium, vitamin B6, and vitamin B2. Pot roast covers your daily need for vitamin B12, 61% more than pork chop. Pot roast contains 3 times more iron than pork chop. While pot roast contains 2.42mg of iron, pork chop contains only 0.87mg. The amount of saturated fat in pork chop is lower. These are the specific foods used in this comparison Beef, chuck, arm pot roast, separable lean, and fat, trimmed to 0" fat, all grades, cooked, braised and Pork, fresh, loin, blade (chops), bone-in, separable lean, and fat, cooked, broiled .
Infographic
Mineral Comparison
Mineral comparison score is based on the number of minerals by which one or the other food is richer. The "coverage" charts below show how much of the daily needs can be covered by 300 grams of the food.
3
100 g
300 g
3 oz - 85g 1 roast (yield from 1601 g raw meat) - 1166g
Magnesium
Magnesium
Calcium
Calcium
Potassium
Potassium
Iron
Iron
Copper
Copper
Zinc
Zinc
Phosphorus
Phosphorus
Sodium
Sodium
Manganese
Manganese
Selenium
Selenium
14%
4.8%
20%
91%
33%
182%
75%
6.1%
1.3%
147%
4
100 g
300 g
3 oz - 85g 1 chop - 219g
Magnesium
Magnesium
Calcium
Calcium
Potassium
Potassium
Iron
Iron
Copper
Copper
Zinc
Zinc
Phosphorus
Phosphorus
Sodium
Sodium
Manganese
Manganese
Selenium
Selenium
14%
17%
28%
33%
35%
86%
103%
9.7%
1.3%
199%
Vitamin Comparison
Vitamin comparison score is based on the number of vitamins by which one or the other food is richer. The "coverage" charts below show how much of the daily needs can be covered by 300 grams of the food.
4
100 g
300 g
3 oz - 85g 1 roast (yield from 1601 g raw meat) - 1166g
Vitamin C
Vit. C
Vitamin D
Vit. D
Vitamin A
Vit. A
Vitamin E
Vit. E
Vitamin B1
Vit. B1
Vitamin B2
Vit. B2
Vitamin B3
Vit. B3
Vitamin B5
Vit. B5
Vitamin B6
Vit. B6
Vitamin B12
Vit. B12
Vitamin K
Vit. K
Folate
Folate
0%
3%
0%
10%
15%
39%
77%
34%
65%
266%
4.5%
6.8%
7
100 g
300 g
3 oz - 85g 1 chop - 219g
Vitamin C
Vit. C
Vitamin D
Vit. D
Vitamin A
Vit. A
Vitamin E
Vit. E
Vitamin B1
Vit. B1
Vitamin B2
Vit. B2
Vitamin B3
Vit. B3
Vitamin B5
Vit. B5
Vitamin B6
Vit. B6
Vitamin B12
Vit. B12
Vitamin K
Vit. K
Folate
Folate
0%
15%
1.3%
4.2%
123%
72%
149%
66%
113%
83%
0%
0%
All nutrients comparison - raw data values
Nutrient
DV% diff.
Vitamin B12
2.13µg
0.66µg
61%
Vitamin B1
0.059mg
0.49mg
36%
Zinc
6.66mg
3.15mg
32%
Vitamin B3
4.105mg
7.927mg
24%
Iron
2.42mg
0.87mg
19%
Selenium
27µg
36.4µg
17%
Vitamin B6
0.283mg
0.489mg
16%
Saturated fat
7.548g
4.339g
15%
Cholesterol
116mg
78mg
13%
Vitamin B2
0.171mg
0.313mg
11%
Vitamin B5
0.571mg
1.104mg
11%
Protein
28.94g
23.72g
10%
Phosphorus
174mg
241mg
10%
Choline
110.2mg
67.5mg
8%
Monounsaturated fat
8.175g
4.887g
8%
Polyunsaturated fat
0.708g
1.894g
8%
Fats
19.17g
14.35g
7%
Vitamin D*
8 IU
40 IU
4%
Vitamin D
0.2µg
1µg
4%
Calcium
16mg
56mg
4%
Calories
297kcal
231kcal
3%
Potassium
231mg
315mg
2%
Vitamin E
0.51mg
0.21mg
2%
Vitamin K
1.8µg
0µg
2%
Folate
9µg
0µg
2%
Copper
0.099mg
0.105mg
1%
Sodium
47mg
74mg
1%
Protein per 100 calories
9.7g
10g
N/A
Calories per 10 g protein
103kcal
97kcal
N/A
Weight per 100 calories
34g
43g
N/A
Unsaturated / Saturated Fat ratio
1.2
1.6
N/A
Magnesium
19mg
20mg
0%
Vitamin A
0µg
4µg
0%
Manganese
0.01mg
0.01mg
0%
Trans fat
0.066g
N/A
Tryptophan
0.19mg
0.282mg
0%
Threonine
1.156mg
1.043mg
0%
Isoleucine
1.317mg
1.123mg
0%
Leucine
2.302mg
1.952mg
0%
Lysine
2.446mg
2.109mg
0%
Methionine
0.754mg
0.65mg
0%
Phenylalanine
1.143mg
0.985mg
0%
Valine
1.436mg
1.2mg
0%
Histidine
0.924mg
0.965mg
0%
Omega-3 - DHA
0g
0.001g
N/A
Omega-3 - ALA
0.065g
N/A
Omega-3 - DPA
0g
0.011g
N/A
Omega-6 - Gamma-linoleic acid
0.003g
N/A
Omega-6 - Eicosadienoic acid
0.065g
N/A
Omega-6 - Linoleic acid
0.922g
N/A
Macronutrient Comparison
Macronutrient breakdown side-by-side comparison
2
29%
19%
52%
Protein:
28.94 g
Fats:
19.17 g
Carbs:
0 g
Water:
51.9 g
Other:
0 g
2
24%
14%
61%
Protein:
23.72 g
Fats:
14.35 g
Carbs:
0 g
Water:
61.45 g
Other:
0.48 g
Contains
more
Protein Protein
+22%
Contains
more
Fats Fats
+33.6%
Contains
more
Water Water
+18.4%
Contains
more
Other Other
+∞%
Fat Type Comparison
Fat type breakdown side-by-side comparison
1
46%
50%
4%
Saturated fat:
Sat. Fat
7.548 g
Monounsaturated fat:
Mono. Fat
8.175 g
Polyunsaturated fat:
Poly. Fat
0.708 g
2
39%
44%
17%
Saturated fat:
Sat. Fat
4.339 g
Monounsaturated fat:
Mono. Fat
4.887 g
Polyunsaturated fat:
Poly. Fat
1.894 g
Contains
more
Mono. Fat Monounsaturated fat
+67.3%
Contains
less
Sat. Fat Saturated fat
-42.5%
Contains
more
Poly. Fat Polyunsaturated fat
+167.5%