Prawn crackers (Shrimp chips) vs. Mozzarella cheese sticks — In-Depth Nutrition Comparison
Compare
Differences between prawn crackers (Shrimp chips) and mozzarella cheese sticks
- Prawn crackers (Shrimp chips) are higher in manganese, selenium, copper, vitamin E, fiber, and iron; however, mozzarella cheese sticks are richer in vitamin B12, calcium, and phosphorus.
- Prawn crackers (Shrimp chips)' daily need coverage for manganese is 77% higher.
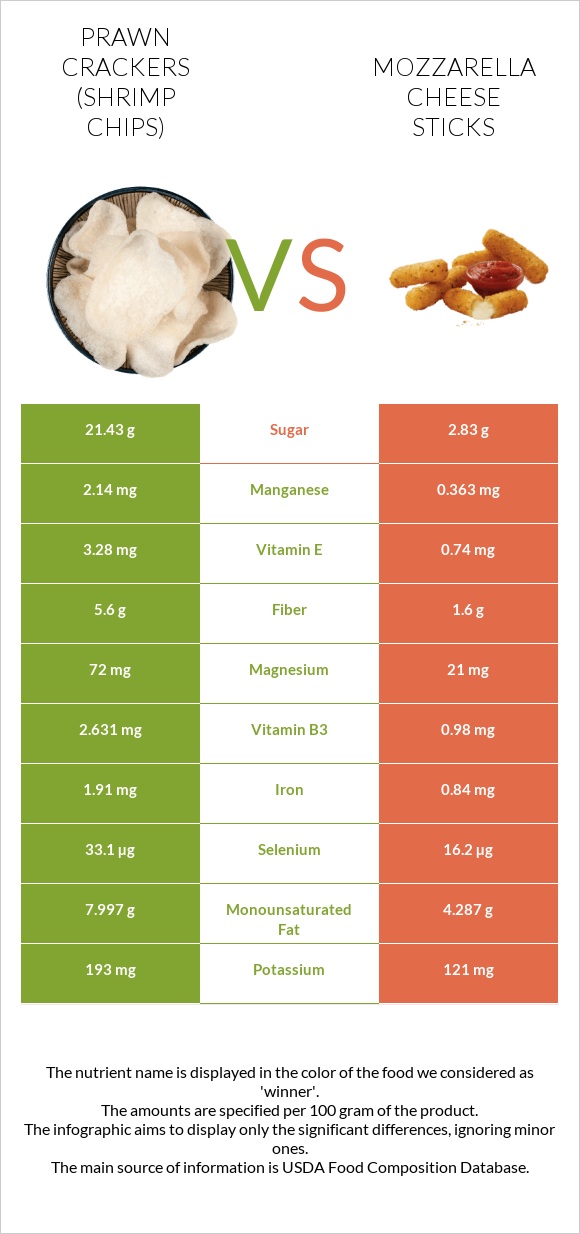
- Prawn crackers (Shrimp chips) have 4 times more vitamin E than mozzarella cheese sticks. While prawn crackers (Shrimp chips) have 3.28mg of vitamin E, mozzarella cheese sticks have only 0.74mg.
- Prawn crackers (Shrimp chips) have less sodium.
The food types used in this comparison are Snacks, shrimp cracker and DENNY'S, mozzarella cheese sticks.
Infographic
Infographic link
Mineral Comparison
Mineral comparison score is based on the number of minerals by which one or the other food is richer. The "coverage" charts below show how much of the daily needs can be covered by 300 grams of the food.
| Contains more MagnesiumMagnesium | +242.9% |
| Contains more PotassiumPotassium | +59.5% |
| Contains more IronIron | +127.4% |
| Contains more CopperCopper | +229.9% |
| Contains less SodiumSodium | -43.4% |
| Contains more ManganeseManganese | +489.5% |
| Contains more SeleniumSelenium | +104.3% |
| Contains more CalciumCalcium | +1555% |
| Contains more ZincZinc | +43.5% |
| Contains more PhosphorusPhosphorus | +87.4% |
Vitamin Comparison
Vitamin comparison score is based on the number of vitamins by which one or the other food is richer. The "coverage" charts below show how much of the daily needs can be covered by 300 grams of the food.
| Contains more Vitamin EVitamin E | +343.2% |
| Contains more Vitamin B1Vitamin B1 | +76% |
| Contains more Vitamin B3Vitamin B3 | +168.5% |
| Contains more Vitamin B6Vitamin B6 | +157.1% |
| Contains more Vitamin AVitamin A | +∞% |
| Contains more Vitamin B2Vitamin B2 | +182.4% |
| Contains more Vitamin B5Vitamin B5 | +18.4% |
| Contains more Vitamin B12Vitamin B12 | +4650% |
| Contains more Vitamin KVitamin K | +98.4% |
| Contains more FolateFolate | +13% |
All nutrients comparison - raw data values
| Nutrient |  |
 |
DV% diff. |
| Manganese | 2.14mg | 0.363mg | 77% |
| Vitamin B12 | 0.02µg | 0.95µg | 39% |
| Calcium | 20mg | 331mg | 31% |
| Selenium | 33.1µg | 16.2µg | 31% |
| Phosphorus | 191mg | 358mg | 24% |
| Sodium | 571mg | 1008mg | 19% |
| Copper | 0.221mg | 0.067mg | 17% |
| Vitamin E | 3.28mg | 0.74mg | 17% |
| Fiber | 5.6g | 1.6g | 16% |
| Protein | 7.14g | 13.56g | 13% |
| Iron | 1.91mg | 0.84mg | 13% |
| Vitamin B2 | 0.091mg | 0.257mg | 13% |
| Magnesium | 72mg | 21mg | 12% |
| Carbs | 59.09g | 27.22g | 11% |
| Vitamin A | 0µg | 96µg | 11% |
| Vitamin K | 12.8µg | 25.4µg | 11% |
| Cholesterol | 2mg | 32mg | 10% |
| Vitamin B1 | 0.264mg | 0.15mg | 10% |
| Vitamin B3 | 2.631mg | 0.98mg | 10% |
| Vitamin B6 | 0.216mg | 0.084mg | 10% |
| Monounsaturated fat | 7.997g | 4.287g | 9% |
| Polyunsaturated fat | 3.971g | 5.104g | 8% |
| Saturated fat | 5.357g | 6.643g | 6% |
| Calories | 426kcal | 324kcal | 5% |
| Zinc | 1.38mg | 1.98mg | 5% |
| Starch | 30.36g | 21.67g | 4% |
| Choline | 17.6mg | 3% | |
| Potassium | 193mg | 121mg | 2% |
| Vitamin B5 | 0.321mg | 0.38mg | 1% |
| Folate | 23µg | 26µg | 1% |
| Protein per 100 calories | 1.676056338028169g | 4.185185185185185g | N/A |
| Calories per 10 g protein | 596.6386554621849kcal | 238.93805309734512kcal | N/A |
| Fats | 17.86g | 17.87g | 0% |
| Net carbs | 53.49g | 25.62g | N/A |
| Sugar | 21.43g | 2.83g | N/A |
| Trans fat | 0.066g | 0.372g | N/A |
| Tryptophan | 0.094mg | 0.175mg | 0% |
| Threonine | 0.2mg | 0.472mg | 0% |
| Isoleucine | 0.242mg | 0.718mg | 0% |
| Leucine | 0.489mg | 1.468mg | 0% |
| Lysine | 0.208mg | 1.211mg | 0% |
| Methionine | 0.126mg | 0.411mg | 0% |
| Phenylalanine | 0.367mg | 0.811mg | 0% |
| Valine | 0.306mg | 0.934mg | 0% |
| Histidine | 0.192mg | 0.441mg | 0% |
| Fructose | 0.02g | 0.2g | 0% |
| Omega-3 - EPA | 0.001g | 0.003g | N/A |
| Omega-3 - DHA | 0.001g | 0g | N/A |
| Omega-3 - ALA | 0.524g | N/A | |
| Omega-3 - DPA | 0g | 0.006g | N/A |
| Omega-3 - Eicosatrienoic acid | 0.001g | N/A | |
| Omega-6 - Gamma-linoleic acid | 0.045g | N/A | |
| Omega-6 - Dihomo-gamma-linoleic acid | 0.011g | N/A | |
| Omega-6 - Eicosadienoic acid | 0g | 0.006g | N/A |
| Omega-6 - Linoleic acid | 4.306g | N/A |
Macronutrient Comparison
Macronutrient breakdown side-by-side comparison
Protein:
7.14 g
Fats:
17.86 g
Carbs:
59.09 g
Water:
13.6 g
Other:
2.31 g
Protein:
13.56 g
Fats:
17.87 g
Carbs:
27.22 g
Water:
37.63 g
Other:
3.72 g
| Contains more CarbsCarbs | +117.1% |
| Contains more ProteinProtein | +89.9% |
| Contains more WaterWater | +176.7% |
| Contains more OtherOther | +61% |
~equal in
Fats
~17.87g
Fat Type Comparison
Fat type breakdown side-by-side comparison
Saturated fat:
Sat. Fat
5.357 g
Monounsaturated fat:
Mono. Fat
7.997 g
Polyunsaturated fat:
Poly. Fat
3.971 g
Saturated fat:
Sat. Fat
6.643 g
Monounsaturated fat:
Mono. Fat
4.287 g
Polyunsaturated fat:
Poly. Fat
5.104 g
| Contains less Sat. FatSaturated fat | -19.4% |
| Contains more Mono. FatMonounsaturated fat | +86.5% |
| Contains more Poly. FatPolyunsaturated fat | +28.5% |
Carbohydrate type comparison
Carbohydrate type breakdown side-by-side comparison
Starch:
30.36 g
Sucrose:
21.4 g
Glucose:
0 g
Fructose:
0.02 g
Lactose:
0 g
Maltose:
0 g
Galactose:
0 g
Starch:
21.67 g
Sucrose:
0 g
Glucose:
0.63 g
Fructose:
0.2 g
Lactose:
1.17 g
Maltose:
0.6 g
Galactose:
0.23 g
| Contains more StarchStarch | +40.1% |
| Contains more SucroseSucrose | +∞% |
| Contains more GlucoseGlucose | +∞% |
| Contains more FructoseFructose | +900% |
| Contains more LactoseLactose | +∞% |
| Contains more MaltoseMaltose | +∞% |
| Contains more GalactoseGalactose | +∞% |


