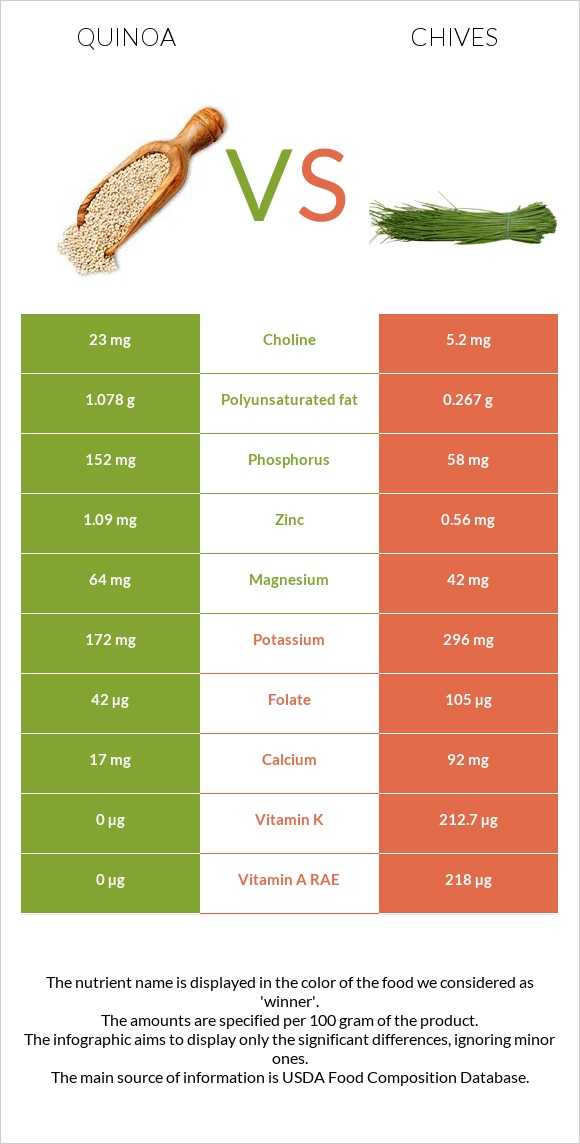
Summary of differences between quinoa and chives Quinoa has more phosphorus, manganese, and magnesium; however, chives are higher in vitamin K, vitamin A, vitamin C, folate, and calcium. Chives cover your daily need for vitamin K, 177% more than quinoa. Quinoa has 3 times more phosphorus than chives. While quinoa has 152mg of phosphorus, chives have only 58mg. These are the specific foods used in this comparison Quinoa, cooked and Chives, raw .
Infographic
Mineral Comparison
Mineral comparison score is based on the number of minerals by which one or the other food is richer. The "coverage" charts below show how much of the daily needs can be covered by 300 grams of the food.
6
100 g
300 g
1 cup - 185g
Magnesium
Magnesium
Calcium
Calcium
Potassium
Potassium
Iron
Iron
Copper
Copper
Zinc
Zinc
Phosphorus
Phosphorus
Sodium
Sodium
Manganese
Manganese
Selenium
Selenium
46%
5.1%
15%
56%
64%
30%
65%
0.91%
82%
15%
3
100 g
300 g
1 tsp chopped - 1g 1 tbsp chopped - 3g
Magnesium
Magnesium
Calcium
Calcium
Potassium
Potassium
Iron
Iron
Copper
Copper
Zinc
Zinc
Phosphorus
Phosphorus
Sodium
Sodium
Manganese
Manganese
Selenium
Selenium
30%
28%
26%
60%
52%
15%
25%
0.39%
49%
4.9%
Vitamin Comparison
Vitamin comparison score is based on the number of vitamins by which one or the other food is richer. The "coverage" charts below show how much of the daily needs can be covered by 300 grams of the food.
2
100 g
300 g
1 cup - 185g
Vitamin C
Vit. C
Vitamin D
Vit. D
Vitamin A
Vit. A
Vitamin E
Vit. E
Vitamin B1
Vit. B1
Vitamin B2
Vit. B2
Vitamin B3
Vit. B3
Vitamin B5
Vit. B5
Vitamin B6
Vit. B6
Vitamin B12
Vit. B12
Vitamin K
Vit. K
Folate
Folate
0%
0%
0%
13%
27%
25%
7.7%
0%
28%
0%
0%
32%
7
100 g
300 g
1 tsp chopped - 1g 1 tbsp chopped - 3g
Vitamin C
Vit. C
Vitamin D
Vit. D
Vitamin A
Vit. A
Vitamin E
Vit. E
Vitamin B1
Vit. B1
Vitamin B2
Vit. B2
Vitamin B3
Vit. B3
Vitamin B5
Vit. B5
Vitamin B6
Vit. B6
Vitamin B12
Vit. B12
Vitamin K
Vit. K
Folate
Folate
194%
0%
73%
4.2%
20%
27%
12%
19%
32%
0%
532%
79%
All nutrients comparison - raw data values
Nutrient
DV% diff.
Vitamin K
0µg
212.7µg
177%
Vitamin C
0mg
58.1mg
65%
Vitamin A
0µg
218µg
24%
Folate
42µg
105µg
16%
Phosphorus
152mg
58mg
13%
Manganese
0.631mg
0.373mg
11%
Calcium
17mg
92mg
8%
Starch
17.63g
7%
Carbs
21.3g
4.35g
6%
Vitamin B5
0.324mg
6%
Calories
120kcal
30kcal
5%
Magnesium
64mg
42mg
5%
Zinc
1.09mg
0.56mg
5%
Polyunsaturated fat
1.078g
0.267g
5%
Potassium
172mg
296mg
4%
Copper
0.192mg
0.157mg
4%
Vitamin E
0.63mg
0.21mg
3%
Selenium
2.8µg
0.9µg
3%
Choline
23mg
5.2mg
3%
Protein
4.4g
3.27g
2%
Fats
1.92g
0.73g
2%
Vitamin B1
0.107mg
0.078mg
2%
Iron
1.49mg
1.6mg
1%
Fiber
2.8g
2.5g
1%
Vitamin B3
0.412mg
0.647mg
1%
Vitamin B6
0.123mg
0.138mg
1%
Monounsaturated fat
0.528g
0.095g
1%
Protein per 100 calories
3.7g
11g
N/A
Calories per 10 g protein
273kcal
92kcal
N/A
Weight per 100 calories
83g
333g
N/A
Net carbs
18.5g
1.85g
N/A
Sugar
0.87g
1.85g
N/A
Sodium
7mg
3mg
0%
Vitamin B2
0.11mg
0.115mg
0%
Saturated fat
0.231g
0.146g
0%
Tryptophan
0.052mg
0.037mg
0%
Threonine
0.131mg
0.128mg
0%
Isoleucine
0.157mg
0.139mg
0%
Leucine
0.261mg
0.195mg
0%
Lysine
0.239mg
0.163mg
0%
Methionine
0.096mg
0.036mg
0%
Phenylalanine
0.185mg
0.105mg
0%
Valine
0.185mg
0.145mg
0%
Histidine
0.127mg
0.057mg
0%
Omega-3 - DHA
0.015g
0g
N/A
Macronutrient Comparison
Macronutrient breakdown side-by-side comparison
3
4%
2%
21%
72%
Protein:
4.4 g
Fats:
1.92 g
Carbs:
21.3 g
Water:
71.61 g
Other:
0.77 g
2
3%
4%
91%
Protein:
3.27 g
Fats:
0.73 g
Carbs:
4.35 g
Water:
90.65 g
Other:
1 g
Contains
more
Protein Protein
+34.6%
Contains
more
Fats Fats
+163%
Contains
more
Carbs Carbs
+389.7%
Contains
more
Water Water
+26.6%
Contains
more
Other Other
+29.9%
Fat Type Comparison
Fat type breakdown side-by-side comparison
2
13%
29%
59%
Saturated fat:
Sat. Fat
0.231 g
Monounsaturated fat:
Mono. Fat
0.528 g
Polyunsaturated fat:
Poly. Fat
1.078 g
1
29%
19%
53%
Saturated fat:
Sat. Fat
0.146 g
Monounsaturated fat:
Mono. Fat
0.095 g
Polyunsaturated fat:
Poly. Fat
0.267 g
Contains
more
Mono. Fat Monounsaturated fat
+455.8%
Contains
more
Poly. Fat Polyunsaturated fat
+303.7%
Contains
less
Sat. Fat Saturated fat
-36.8%