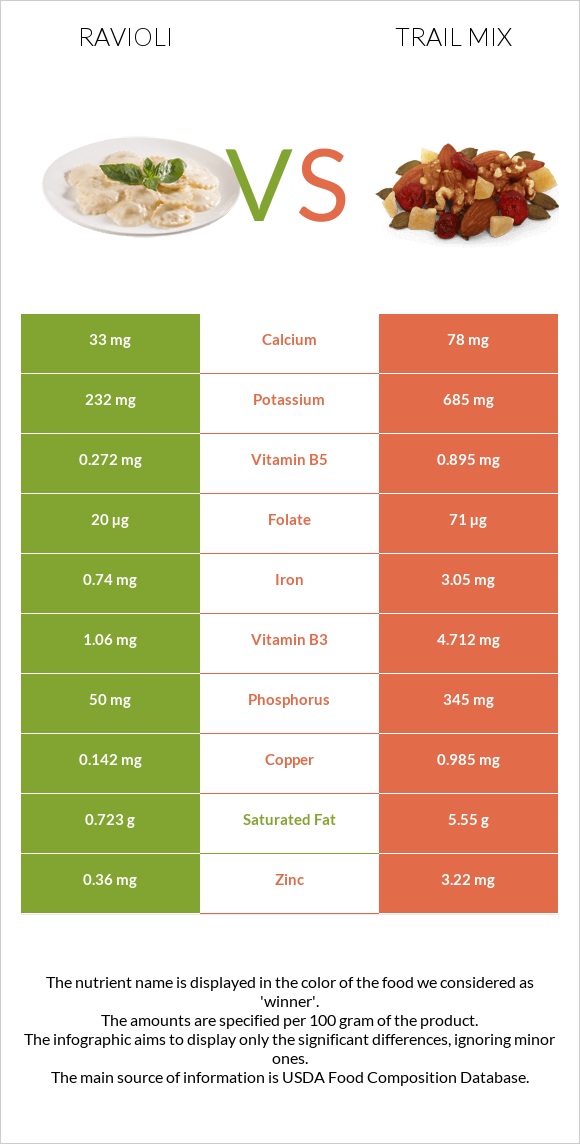
How are ravioli and trail mix different? Ravioli contains less copper, phosphorus, manganese, magnesium, vitamin B1, iron, zinc, vitamin B3, and vitamin B6 than trail mix. Trail mix covers your daily need for copper, 94% more than ravioli. Ravioli contains less saturated fat. Ravioli has a higher glycemic index. The glycemic index of ravioli is 39, while the glycemic index of trail mix is 15. Ravioli, cheese-filled, canned and Snacks, trail mix, regular types were used in this article.
Infographic
Mineral Comparison
Mineral comparison score is based on the number of minerals by which one or the other food is richer. The "coverage" charts below show how much of the daily needs can be covered by 300 grams of the food.
1
100 g
300 g
1 cup - 242g
Magnesium
Magnesium
Calcium
Calcium
Potassium
Potassium
Iron
Iron
Copper
Copper
Zinc
Zinc
Phosphorus
Phosphorus
Sodium
Sodium
Manganese
Manganese
Selenium
Selenium
11%
9.9%
20%
28%
47%
9.8%
21%
40%
23%
19%
9
100 g
300 g
1 oz - 28.35g 1.5 oz - 42g 1 cup - 150g
Magnesium
Magnesium
Calcium
Calcium
Potassium
Potassium
Iron
Iron
Copper
Copper
Zinc
Zinc
Phosphorus
Phosphorus
Sodium
Sodium
Manganese
Manganese
Selenium
Selenium
113%
23%
60%
114%
328%
88%
148%
30%
135%
0%
Vitamin Comparison
Vitamin comparison score is based on the number of vitamins by which one or the other food is richer. The "coverage" charts below show how much of the daily needs can be covered by 300 grams of the food.
4
100 g
300 g
1 cup - 242g
Vitamin C
Vit. C
Vitamin D
Vit. D
Vitamin A
Vit. A
Vitamin E
Vit. E
Vitamin B1
Vit. B1
Vitamin B2
Vit. B2
Vitamin B3
Vit. B3
Vitamin B5
Vit. B5
Vitamin B6
Vit. B6
Vitamin B12
Vit. B12
Vitamin K
Vit. K
Folate
Folate
0%
0%
3.3%
17%
19%
18%
20%
16%
24%
3.8%
5.8%
15%
7
100 g
300 g
1 oz - 28.35g 1.5 oz - 42g 1 cup - 150g
Vitamin C
Vit. C
Vitamin D
Vit. D
Vitamin A
Vit. A
Vitamin E
Vit. E
Vitamin B1
Vit. B1
Vitamin B2
Vit. B2
Vitamin B3
Vit. B3
Vitamin B5
Vit. B5
Vitamin B6
Vit. B6
Vitamin B12
Vit. B12
Vitamin K
Vit. K
Folate
Folate
4.7%
0%
0.33%
0%
116%
46%
88%
54%
69%
0%
0%
53%
All nutrients comparison - raw data values
Nutrient
DV% diff.
Copper
0.142mg
0.985mg
94%
Polyunsaturated fat
0.182g
9.65g
63%
Fats
1.45g
29.4g
43%
Phosphorus
50mg
345mg
42%
Manganese
0.176mg
1.034mg
37%
Magnesium
15mg
158mg
34%
Vitamin B1
0.074mg
0.462mg
32%
Monounsaturated fat
0.418g
12.53g
30%
Iron
0.74mg
3.05mg
29%
Zinc
0.36mg
3.22mg
26%
Protein
2.48g
13.8g
23%
Vitamin B3
1.06mg
4.712mg
23%
Saturated fat
0.723g
5.55g
22%
Calories
77kcal
462kcal
19%
Vitamin B6
0.102mg
0.298mg
15%
Potassium
232mg
685mg
13%
Folate
20µg
71µg
13%
Vitamin B5
0.272mg
0.895mg
12%
Carbs
13.64g
44.9g
10%
Vitamin B2
0.08mg
0.198mg
9%
Vitamin E
0.85mg
6%
Selenium
3.5µg
6%
Calcium
33mg
78mg
5%
Fiber
1.3g
5%
Sodium
306mg
229mg
3%
Vitamin C
0mg
1.4mg
2%
Vitamin K
2.3µg
2%
Choline
9.5mg
2%
Cholesterol
3mg
0mg
1%
Vitamin A
10µg
1µg
1%
Vitamin B12
0.03µg
0µg
1%
Protein per 100 calories
3.2g
3g
N/A
Calories per 10 g protein
310kcal
335kcal
N/A
Weight per 100 calories
130g
22g
N/A
Unsaturated / Saturated Fat ratio
0.83
4
N/A
Net carbs
12.34g
44.9g
N/A
Sugar
3.72g
N/A
Tryptophan
0.166mg
0%
Threonine
0.482mg
0%
Isoleucine
0.515mg
0%
Leucine
0.89mg
0%
Lysine
0.515mg
0%
Methionine
0.202mg
0%
Phenylalanine
0.658mg
0%
Valine
0.658mg
0%
Histidine
0.357mg
0%
Macronutrient Comparison
Macronutrient breakdown side-by-side comparison
1
2%
14%
81%
Protein:
2.48 g
Fats:
1.45 g
Carbs:
13.64 g
Water:
80.91 g
Other:
1.52 g
4
14%
29%
45%
9%
3%
Protein:
13.8 g
Fats:
29.4 g
Carbs:
44.9 g
Water:
9.2 g
Other:
2.7 g
Contains
more
Water Water
+779.5%
Contains
more
Protein Protein
+456.5%
Contains
more
Fats Fats
+1927.6%
Contains
more
Carbs Carbs
+229.2%
Contains
more
Other Other
+77.6%
Fat Type Comparison
Fat type breakdown side-by-side comparison
1
55%
32%
14%
Saturated fat:
Sat. Fat
0.723 g
Monounsaturated fat:
Mono. Fat
0.418 g
Polyunsaturated fat:
Poly. Fat
0.182 g
2
20%
45%
35%
Saturated fat:
Sat. Fat
5.55 g
Monounsaturated fat:
Mono. Fat
12.53 g
Polyunsaturated fat:
Poly. Fat
9.65 g
Contains
less
Sat. Fat Saturated fat
-87%
Contains
more
Mono. Fat Monounsaturated fat
+2897.6%
Contains
more
Poly. Fat Polyunsaturated fat
+5202.2%