Refried beans vs. Jelly bean — In-Depth Nutrition Comparison
Compare
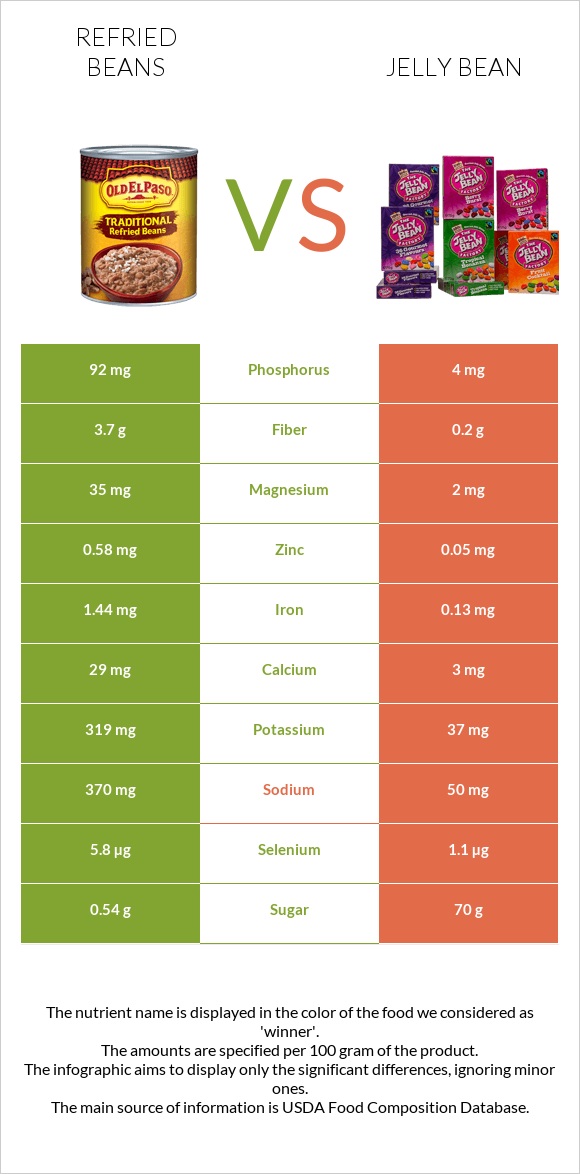
Differences between refried beans and jelly bean
- Jelly bean contains less iron, fiber, phosphorus, copper, manganese, selenium, potassium, magnesium, and vitamin B6 than refried beans.
- Refried beans' daily need coverage for iron is 16% higher.
- Jelly bean contains 26 times less vitamin B6 than refried beans. Refried beans contain 0.103mg of vitamin B6, while jelly bean contains 0.004mg.
- The amount of sodium in jelly bean is lower.
- Refried beans have a lower glycemic index. The glycemic index of refried beans is 38, while the glycemic index of jelly bean is 80.
The food types used in this comparison are Refried beans, canned, traditional style (includes USDA commodity) and Candies, jellybeans.
Infographic
Infographic link
Mineral Comparison
Mineral comparison score is based on the number of minerals by which one or the other food is richer. The "coverage" charts below show how much of the daily needs can be covered by 300 grams of the food.
| Contains more MagnesiumMagnesium | +1650% |
| Contains more CalciumCalcium | +866.7% |
| Contains more PotassiumPotassium | +762.2% |
| Contains more IronIron | +1007.7% |
| Contains more CopperCopper | +360.7% |
| Contains more ZincZinc | +1060% |
| Contains more PhosphorusPhosphorus | +2200% |
| Contains more ManganeseManganese | +725.7% |
| Contains more SeleniumSelenium | +427.3% |
| Contains less SodiumSodium | -86.5% |
Vitamin Comparison
Vitamin comparison score is based on the number of vitamins by which one or the other food is richer. The "coverage" charts below show how much of the daily needs can be covered by 300 grams of the food.
| Contains more Vitamin CVitamin C | +∞% |
| Contains more Vitamin EVitamin E | +∞% |
| Contains more Vitamin B1Vitamin B1 | +1800% |
| Contains more Vitamin B2Vitamin B2 | +618.2% |
| Contains more Vitamin B3Vitamin B3 | +4487.5% |
| Contains more Vitamin B5Vitamin B5 | +2000% |
| Contains more Vitamin B6Vitamin B6 | +2475% |
| Contains more Vitamin KVitamin K | +∞% |
| Contains more FolateFolate | +∞% |
All nutrients comparison - raw data values
| Nutrient |  |
 |
DV% diff. |
| Carbs | 13.55g | 93.55g | 27% |
| Histidine | 153mg | 22% | |
| Iron | 1.44mg | 0.13mg | 16% |
| Calories | 90kcal | 375kcal | 14% |
| Fiber | 3.7g | 0.2g | 14% |
| Sodium | 370mg | 50mg | 14% |
| Phosphorus | 92mg | 4mg | 13% |
| Copper | 0.129mg | 0.028mg | 11% |
| Manganese | 0.289mg | 0.035mg | 11% |
| Protein | 4.98g | 0g | 10% |
| Selenium | 5.8µg | 1.1µg | 9% |
| Magnesium | 35mg | 2mg | 8% |
| Potassium | 319mg | 37mg | 8% |
| Vitamin B6 | 0.103mg | 0.004mg | 8% |
| Vitamin C | 6mg | 0mg | 7% |
| Vitamin B1 | 0.076mg | 0.004mg | 6% |
| Zinc | 0.58mg | 0.05mg | 5% |
| Vitamin B2 | 0.079mg | 0.011mg | 5% |
| Vitamin B5 | 0.189mg | 0.009mg | 4% |
| Choline | 21.2mg | 0mg | 4% |
| Polyunsaturated fat | 0.543g | 0g | 4% |
| Fats | 2.01g | 0.05g | 3% |
| Calcium | 29mg | 3mg | 3% |
| Starch | 7.43g | 3% | |
| Folate | 11µg | 0µg | 3% |
| Saturated fat | 0.631g | 0g | 3% |
| Vitamin B3 | 0.367mg | 0.008mg | 2% |
| Vitamin K | 2.1µg | 0µg | 2% |
| Monounsaturated fat | 0.601g | 0g | 2% |
| Vitamin E | 0.09mg | 0mg | 1% |
| Net carbs | 9.85g | 93.35g | N/A |
| Sugar | 0.54g | 70g | N/A |
| Trans fat | 0.016g | N/A | |
| Tryptophan | 0.065mg | 0% | |
| Threonine | 0.231mg | 0% | |
| Isoleucine | 0.242mg | 0% | |
| Leucine | 0.438mg | 0% | |
| Lysine | 0.377mg | 0% | |
| Methionine | 0.083mg | 0% | |
| Phenylalanine | 0.297mg | 0% | |
| Valine | 0.287mg | 0% | |
| Omega-3 - ALA | 0.169g | N/A | |
| Omega-3 - Eicosatrienoic acid | 0.001g | N/A | |
| Omega-6 - Eicosadienoic acid | 0.008g | N/A | |
| Omega-6 - Linoleic acid | 0.36g | N/A |
Macronutrient Comparison
Macronutrient breakdown side-by-side comparison
Protein:
4.98 g
Fats:
2.01 g
Carbs:
13.55 g
Water:
77.75 g
Other:
1.71 g
Protein:
0 g
Fats:
0.05 g
Carbs:
93.55 g
Water:
6.3 g
Other:
0.1 g
| Contains more ProteinProtein | +∞% |
| Contains more FatsFats | +3920% |
| Contains more WaterWater | +1134.1% |
| Contains more OtherOther | +1610% |
| Contains more CarbsCarbs | +590.4% |


