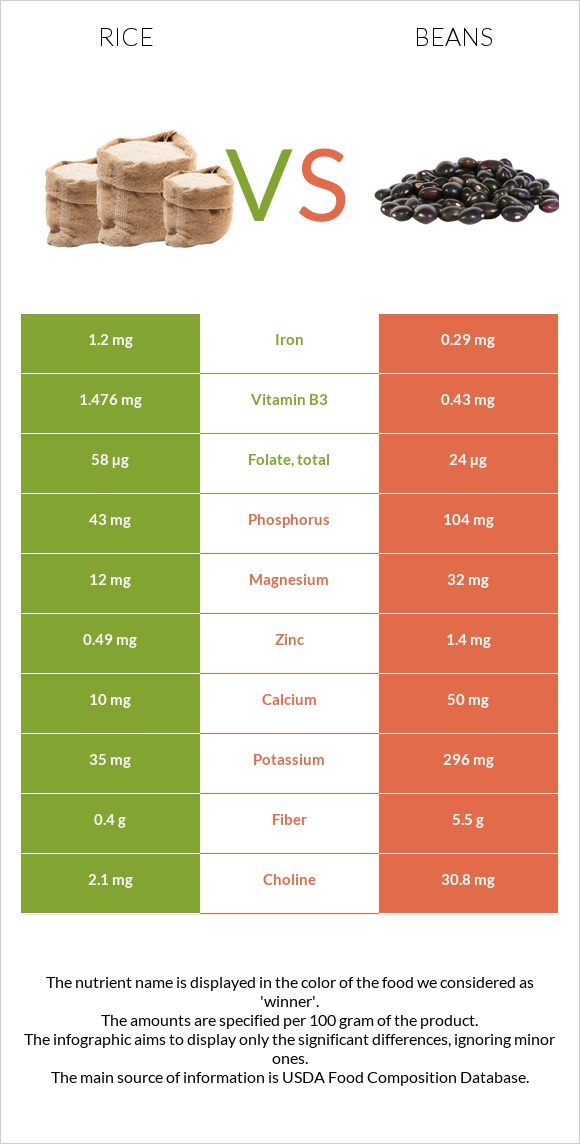
The main differences between rice and beans Rice is richer in iron, folate, vitamin B3, and selenium, yet beans are richer in fiber, copper, phosphorus, zinc, potassium, and choline. Daily need coverage for fiber for beans is 20% higher. Rice contains 4 times more iron than beans. Rice contains 1.2mg of iron, while beans contain 0.29mg. Beans have a lower glycemic index than rice. Food types used in this article are Rice, white, long-grain, regular, enriched, cooked and Beans, baked, canned, no salt added .
Infographic
Mineral Comparison
Mineral comparison score is based on the number of minerals by which one or the other food is richer. The "coverage" charts below show how much of the daily needs can be covered by 300 grams of the food.
3
100 g
300 g
1 cup - 158g
Magnesium
Magnesium
Calcium
Calcium
Potassium
Potassium
Iron
Iron
Copper
Copper
Zinc
Zinc
Phosphorus
Phosphorus
Sodium
Sodium
Manganese
Manganese
Selenium
Selenium
8.6%
3%
3.1%
45%
23%
13%
18%
0.13%
62%
41%
6
100 g
300 g
1 cup - 253g
Magnesium
Magnesium
Calcium
Calcium
Potassium
Potassium
Iron
Iron
Copper
Copper
Zinc
Zinc
Phosphorus
Phosphorus
Sodium
Sodium
Manganese
Manganese
Selenium
Selenium
23%
15%
26%
11%
69%
38%
45%
0.13%
0%
25%
Vitamin Comparison
Vitamin comparison score is based on the number of vitamins by which one or the other food is richer. The "coverage" charts below show how much of the daily needs can be covered by 300 grams of the food.
3
100 g
300 g
1 cup - 158g
Vitamin C
Vit. C
Vitamin D
Vit. D
Vitamin A
Vit. A
Vitamin E
Vit. E
Vitamin B1
Vit. B1
Vitamin B2
Vit. B2
Vitamin B3
Vit. B3
Vitamin B5
Vit. B5
Vitamin B6
Vit. B6
Vitamin B12
Vit. B12
Vitamin K
Vit. K
Folate
Folate
0%
0%
0%
0.8%
41%
3%
28%
23%
21%
0%
0%
44%
6
100 g
300 g
1 cup - 253g
Vitamin C
Vit. C
Vitamin D
Vit. D
Vitamin A
Vit. A
Vitamin E
Vit. E
Vitamin B1
Vit. B1
Vitamin B2
Vit. B2
Vitamin B3
Vit. B3
Vitamin B5
Vit. B5
Vitamin B6
Vit. B6
Vitamin B12
Vit. B12
Vitamin K
Vit. K
Folate
Folate
10%
0%
1.7%
3%
38%
14%
8.1%
0%
30%
0%
2%
18%
All nutrients comparison - raw data values
Nutrient
DV% diff.
Manganese
0.472mg
21%
Fiber
0.4g
5.5g
20%
Copper
0.069mg
0.206mg
15%
Iron
1.2mg
0.29mg
11%
Phosphorus
43mg
104mg
9%
Folate
58µg
24µg
9%
Potassium
35mg
296mg
8%
Zinc
0.49mg
1.4mg
8%
Vitamin B5
0.39mg
8%
Vitamin B3
1.476mg
0.43mg
7%
Magnesium
12mg
32mg
5%
Selenium
7.5µg
4.5µg
5%
Choline
2.1mg
30.8mg
5%
Protein
2.69g
4.8g
4%
Calcium
10mg
50mg
4%
Vitamin B2
0.013mg
0.06mg
4%
Vitamin C
0mg
3.1mg
3%
Carbs
28.17g
20.49g
3%
Vitamin B6
0.093mg
0.13mg
3%
Calories
130kcal
105kcal
1%
Vitamin A
0µg
5µg
1%
Vitamin E
0.04mg
0.15mg
1%
Vitamin B1
0.163mg
0.15mg
1%
Vitamin K
0µg
0.8µg
1%
Polyunsaturated fat
0.076g
0.172g
1%
Protein per 100 calories
2.1g
4.6g
N/A
Calories per 10 g protein
483kcal
219kcal
N/A
Weight per 100 calories
77g
95g
N/A
Fats
0.28g
0.4g
0%
Net carbs
27.77g
14.99g
N/A
Sugar
0.05g
7.78g
N/A
Sodium
1mg
1mg
0%
Saturated fat
0.077g
0.103g
0%
Monounsaturated fat
0.088g
0.035g
0%
Tryptophan
0.031mg
0%
Threonine
0.096mg
0%
Isoleucine
0.116mg
0%
Leucine
0.222mg
0%
Lysine
0.097mg
0%
Methionine
0.063mg
0%
Phenylalanine
0.144mg
0%
Valine
0.164mg
0%
Histidine
0.063mg
0%
Macronutrient Comparison
Macronutrient breakdown side-by-side comparison
1
3%
28%
68%
Protein:
2.69 g
Fats:
0.28 g
Carbs:
28.17 g
Water:
68.44 g
Other:
0.42 g
4
5%
20%
73%
2%
Protein:
4.8 g
Fats:
0.4 g
Carbs:
20.49 g
Water:
72.6 g
Other:
1.71 g
Contains
more
Carbs Carbs
+37.5%
Contains
more
Protein Protein
+78.4%
Contains
more
Fats Fats
+42.9%
Contains
more
Other Other
+307.1%
Fat Type Comparison
Fat type breakdown side-by-side comparison
2
32%
37%
32%
Saturated fat:
Sat. Fat
0.077 g
Monounsaturated fat:
Mono. Fat
0.088 g
Polyunsaturated fat:
Poly. Fat
0.076 g
1
33%
11%
55%
Saturated fat:
Sat. Fat
0.103 g
Monounsaturated fat:
Mono. Fat
0.035 g
Polyunsaturated fat:
Poly. Fat
0.172 g
Contains
less
Sat. Fat Saturated fat
-25.2%
Contains
more
Mono. Fat Monounsaturated fat
+151.4%
Contains
more
Poly. Fat Polyunsaturated fat
+126.3%