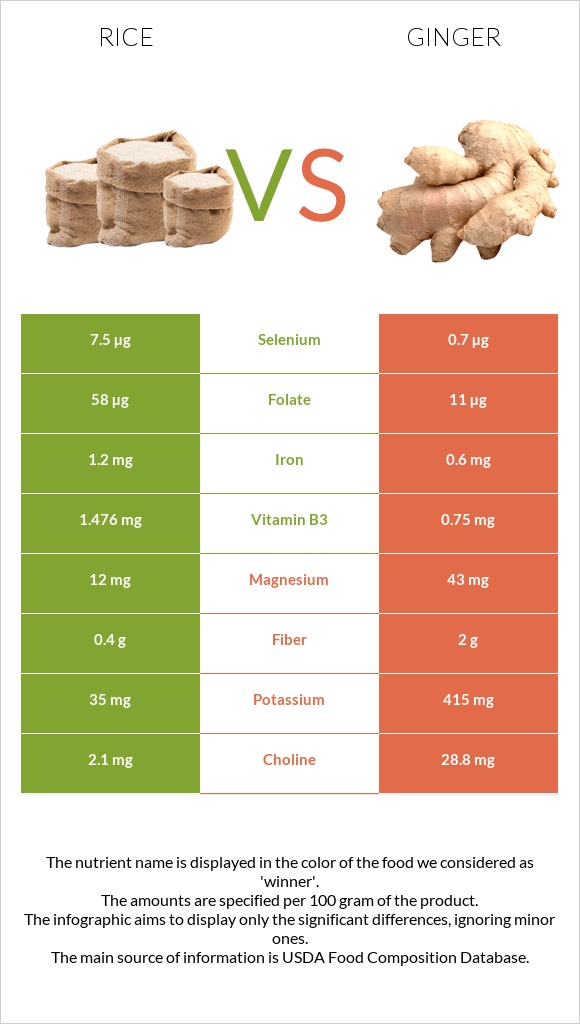
Differences between rice and ginger Rice has more selenium, folate, vitamin B1, manganese, and iron, while ginger has more copper, potassium, magnesium, fiber, and vitamin C. Ginger's daily need coverage for copper is 17% higher. Ginger contains 11 times less selenium than rice. Rice contains 7.5µg of selenium, while ginger contains 0.7µg. Ginger has a lower glycemic index. The glycemic index of ginger is 10, while the glycemic index of rice is 60. The food types used in this comparison are Rice, white, long-grain, regular, enriched, cooked and Ginger root, raw .
Infographic
Mineral Comparison
Mineral comparison score is based on the number of minerals by which one or the other food is richer. The "coverage" charts below show how much of the daily needs can be covered by 300 grams of the food.
6
100 g
300 g
1 cup - 158g
Magnesium
Magnesium
Calcium
Calcium
Potassium
Potassium
Iron
Iron
Copper
Copper
Zinc
Zinc
Phosphorus
Phosphorus
Sodium
Sodium
Manganese
Manganese
Selenium
Selenium
8.6%
3%
3.1%
45%
23%
13%
18%
0.13%
62%
41%
4
100 g
300 g
1 tsp - 2g 5 slices (1" dia) - 11g 0.25 cup slices (1" dia) - 24g
Magnesium
Magnesium
Calcium
Calcium
Potassium
Potassium
Iron
Iron
Copper
Copper
Zinc
Zinc
Phosphorus
Phosphorus
Sodium
Sodium
Manganese
Manganese
Selenium
Selenium
31%
4.8%
37%
23%
75%
9.3%
15%
1.7%
30%
3.8%
Vitamin Comparison
Vitamin comparison score is based on the number of vitamins by which one or the other food is richer. The "coverage" charts below show how much of the daily needs can be covered by 300 grams of the food.
4
100 g
300 g
1 cup - 158g
Vitamin C
Vit. C
Vitamin D
Vit. D
Vitamin A
Vit. A
Vitamin E
Vit. E
Vitamin B1
Vit. B1
Vitamin B2
Vit. B2
Vitamin B3
Vit. B3
Vitamin B5
Vit. B5
Vitamin B6
Vit. B6
Vitamin B12
Vit. B12
Vitamin K
Vit. K
Folate
Folate
0%
0%
0%
0.8%
41%
3%
28%
23%
21%
0%
0%
44%
5
100 g
300 g
1 tsp - 2g 5 slices (1" dia) - 11g 0.25 cup slices (1" dia) - 24g
Vitamin C
Vit. C
Vitamin D
Vit. D
Vitamin A
Vit. A
Vitamin E
Vit. E
Vitamin B1
Vit. B1
Vitamin B2
Vit. B2
Vitamin B3
Vit. B3
Vitamin B5
Vit. B5
Vitamin B6
Vit. B6
Vitamin B12
Vit. B12
Vitamin K
Vit. K
Folate
Folate
17%
0%
0%
5.2%
6.3%
7.8%
14%
12%
37%
0%
0.25%
8.3%
All nutrients comparison - raw data values
Nutrient
DV% diff.
Copper
0.069mg
0.226mg
17%
Selenium
7.5µg
0.7µg
12%
Vitamin B1
0.163mg
0.025mg
12%
Folate
58µg
11µg
12%
Potassium
35mg
415mg
11%
Manganese
0.472mg
0.229mg
11%
Iron
1.2mg
0.6mg
8%
Magnesium
12mg
43mg
7%
Vitamin C
0mg
5mg
6%
Fiber
0.4g
2g
6%
Vitamin B3
1.476mg
0.75mg
5%
Vitamin B6
0.093mg
0.16mg
5%
Choline
2.1mg
28.8mg
5%
Vitamin B5
0.39mg
0.203mg
4%
Calories
130kcal
80kcal
3%
Carbs
28.17g
17.77g
3%
Protein
2.69g
1.82g
2%
Vitamin B2
0.013mg
0.034mg
2%
Fats
0.28g
0.75g
1%
Calcium
10mg
16mg
1%
Zinc
0.49mg
0.34mg
1%
Phosphorus
43mg
34mg
1%
Sodium
1mg
13mg
1%
Vitamin E
0.04mg
0.26mg
1%
Saturated fat
0.077g
0.203g
1%
Polyunsaturated fat
0.076g
0.154g
1%
Protein per 100 calories
2.1g
2.3g
N/A
Calories per 10 g protein
483kcal
440kcal
N/A
Weight per 100 calories
77g
125g
N/A
Net carbs
27.77g
15.77g
N/A
Sugar
0.05g
1.7g
N/A
Vitamin K
0µg
0.1µg
0%
Monounsaturated fat
0.088g
0.154g
0%
Tryptophan
0.031mg
0.012mg
0%
Threonine
0.096mg
0.036mg
0%
Isoleucine
0.116mg
0.051mg
0%
Leucine
0.222mg
0.074mg
0%
Lysine
0.097mg
0.057mg
0%
Methionine
0.063mg
0.013mg
0%
Phenylalanine
0.144mg
0.045mg
0%
Valine
0.164mg
0.073mg
0%
Histidine
0.063mg
0.03mg
0%
Macronutrient Comparison
Macronutrient breakdown side-by-side comparison
2
3%
28%
68%
Protein:
2.69 g
Fats:
0.28 g
Carbs:
28.17 g
Water:
68.44 g
Other:
0.42 g
3
2%
18%
79%
Protein:
1.82 g
Fats:
0.75 g
Carbs:
17.77 g
Water:
78.89 g
Other:
0.77 g
Contains
more
Protein Protein
+47.8%
Contains
more
Carbs Carbs
+58.5%
Contains
more
Fats Fats
+167.9%
Contains
more
Water Water
+15.3%
Contains
more
Other Other
+83.3%
Fat Type Comparison
Fat type breakdown side-by-side comparison
1
32%
37%
32%
Saturated fat:
Sat. Fat
0.077 g
Monounsaturated fat:
Mono. Fat
0.088 g
Polyunsaturated fat:
Poly. Fat
0.076 g
2
40%
30%
30%
Saturated fat:
Sat. Fat
0.203 g
Monounsaturated fat:
Mono. Fat
0.154 g
Polyunsaturated fat:
Poly. Fat
0.154 g
Contains
less
Sat. Fat Saturated fat
-62.1%
Contains
more
Mono. Fat Monounsaturated fat
+75%
Contains
more
Poly. Fat Polyunsaturated fat
+102.6%