Rice vs. Mashed potato — Health Impact and Nutrition Comparison


Summary
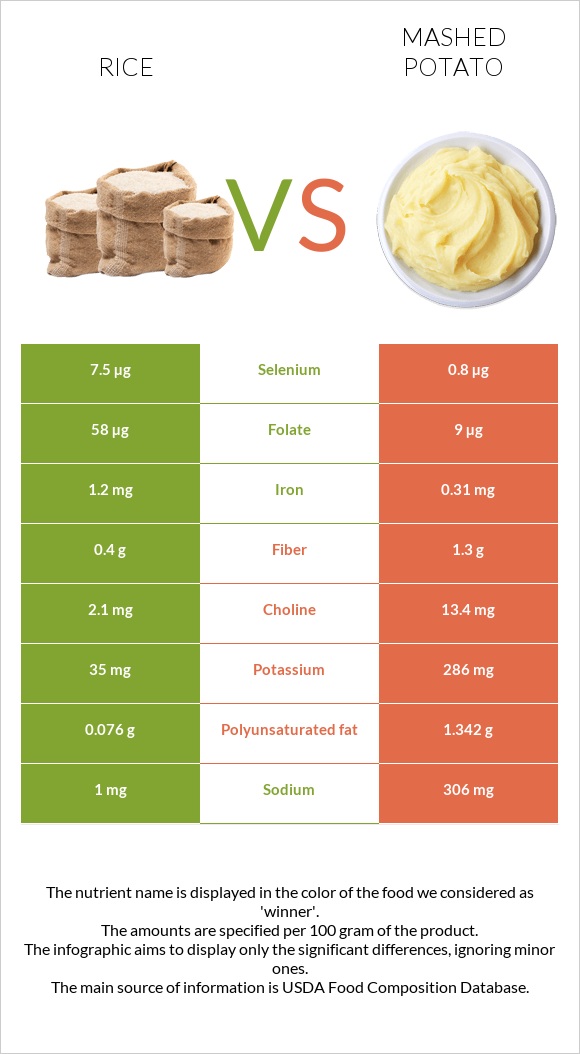
Mashed potatoes have higher potassium and polyunsaturated fat, but rice is higher in manganese, vitamin B1, folate, selenium, and iron. Interestingly, rice provides 16% more manganese than mashed potatoes. However, there is a huge variation in Sodium concentration, with mashed potatoes containing 306 times more than rice.
Table of contents
Introduction
Mashed potatoes, a cherished classic, result from cooking and mashing potatoes with butter, milk, or cream. Enhanced by diverse herbs and spices, mashed potatoes adapt well as a side dish.
Rice, a grain with various shapes and colors, has long, white, standard, and enriched rice types. Note that it's advisable not to discard the boiling water with enriched rice, as it contains essential components. Rice holds immense global significance in cuisines like Mexican, Asian, Arabic, and Eurasian.
Varieties and Culinary World
Mashed potatoes are crafted through the boiling and mashing of potatoes. With customizable variations incorporating garlic, herbs, cheeses, or bacon, mashed potatoes cater to diverse cuisines. The creamy consistency can be adjusted to individual preferences, from chunky to velvety smooth.
In contrast, rice, a staple cereal grain, is widely utilized in culinary practices. Rice's usage extends to soups, desserts such as rice pudding, and diet-conscious rice cakes. The rice should be cooked, as consuming it raw risks contamination.
Nutrition
This article will contrast 100g of mashed potatoes with rice.
Macronutrients and Calories
Mashed potatoes exhibit a higher fat content (2.82g) by 907.1%, an increased water content (79.62g) by 16.3%, and a notable rise in other constituents (1.26g) by 200%. Conversely, rice displays a comparatively higher protein content (2.69g) by 63% and more carbohydrates (28.17g) by 92.3%. This comparison underlines mashed potatoes' elevated fat, water, and other components, making them unique in their composition. Meanwhile, rice stands out with its increased protein and carbohydrate content.
Macronutrient Comparison
Contains
more
ProteinProtein
+63%
Contains
more
CarbsCarbs
+92.3%
Contains
more
FatsFats
+907.1%
Contains
more
WaterWater
+16.3%
Contains
more
OtherOther
+200%
Calories
Rice has 130 kcal of calories; however, mashed potatoes have 89 kcal, making them a lower-calorie alternative.
Protein
Mashed potatoes only have 1.65g of protein, whereas rice has 2.69g.
Fats
Comparing the fat types in mashed potatoes and rice, mashed potatoes have a higher proportion of monounsaturated and polyunsaturated fat, with values of 0.72g and 1.342g. In contrast, rice contains relatively lower amounts of monounsaturated fat and polyunsaturated fat, with values of 0.088g and 0.076 g, respectively. Mashed potatoes significantly stand out with a substantial increase in monounsaturated fat and a remarkable increase in polyunsaturated fat compared to rice. Moreover, mashed potatoes notably reduce saturated fat compared to rice.
Fat Type Comparison
Contains
less
Sat. FatSaturated fat
-86.7%
Contains
more
Mono. FatMonounsaturated fat
+718.2%
Contains
more
Poly. FatPolyunsaturated fat
+1665.8%
Carbohydrates
Rice has more net carbohydrates (27.77g) than mashed potatoes (13.35g), so potatoes are a comparatively lower-carb choice.
Vitamins
Mashed potatoes are much higher in vitamins A, A, RAE, and E than rice. However, rice has higher vitamin B1, B5, folate, and vitamin B12 levels than mashed potatoes. Interestingly, rice doesn't contain vitamin K, whereas mashed potatoes do. The amounts of vitamins B2, B3, and B6 are essentially the same.
Vitamin Comparison
Contains
more
Vitamin B1Vitamin B1
+986.7%
Contains
more
Vitamin B3Vitamin B3
+36.7%
Contains
more
Vitamin B5Vitamin B5
+∞%
Contains
more
FolateFolate
+544.4%
Contains
more
Vitamin AVitamin A
+∞%
Contains
more
Vitamin EVitamin E
+950%
Contains
more
Vitamin B2Vitamin B2
+15.4%
Contains
more
Vitamin B6Vitamin B6
+29%
Contains
more
Vitamin B12Vitamin B12
+∞%
Contains
more
Vitamin KVitamin K
+∞%
Minerals
Mashed potatoes have slightly higher levels of Calcium, Magnesium, Phosphorus, and Potassium compared to rice.
Rice surpasses mashed potatoes in Iron, Zinc, Copper, Manganese, and Selenium content.
Notably, rice contains significantly less Sodium, whereas mashed potatoes have a remarkably higher Sodium content.
Mineral Comparison
Contains
more
IronIron
+287.1%
Contains
more
CopperCopper
+97.1%
Contains
more
ZincZinc
+122.7%
Contains
less
SodiumSodium
-99.7%
Contains
more
ManganeseManganese
+381.6%
Contains
more
SeleniumSelenium
+837.5%
Contains
more
MagnesiumMagnesium
+25%
Contains
more
CalciumCalcium
+80%
Contains
more
PotassiumPotassium
+717.1%
Contains
more
PhosphorusPhosphorus
+37.2%
Glycemic Index
The average glycemic index value of mashed potatoes is 87. On the other hand, the glycemic index value of rice is 60.
Visit our Glycemic Index Chart page to learn the glycemic index scores of various foods.
Glycemic Load
Both mashed potatoes and rice have high glycemic loads, with mashed potatoes having a glycemic load of 28 and rice having a slightly lower glycemic load of 26.
Insulin Index
Mashed potatoes have a higher insulin index (118) than rice, which has a lower insulin index (79).
Acidity
Mashed potatoes have a lower acidity based on PRAL (-3.6 alkaline) than rice, which has a higher acidity based on PRAL (1.7 acidic).
Weight Loss and Diets
Regarding weight loss and dietary considerations, mashed potatoes can be enjoyed in moderation with a balanced diet. Portion control is essential due to the calorie density of added butter and milk. Mashed potatoes might not align well with keto diets due to their carb content. However, vegetarian, pescetarian and vegan diets can be embraced using plant-based alternatives.
In contrast, rice offers diverse dietary roles:
Rice in Weight Loss: Associated with Asian cuisine, rice can contribute to weight loss by promoting satiety and controlling calorie intake. However, portion management remains crucial.
Diet Compatibility: Rice serves well in vegan diets and as a dairy substitute. However, its high carb content makes it unsuitable for keto diets.
Bodybuilding: Rice is beneficial for quick, absorbable carbs pre- or post-workout.
Baby Food: Due to their digestibility, rice-based baby formulas are standard and gentler for infants.
Rice Diet: The calorie-restricted rice diet claims weight loss benefits, but experts warn against its sustainability due to potential nutrient deficiencies.
Gluten-Free and Lactose Intolerance: Rice is gluten-free and safe for people with celiac disease, and rice milk is an alternative for those with lactose intolerance.
Health Impact
Cardiovascular Health
Some peptides in rice and potato may inhibit the activity of ACE (angiotensin-converting enzyme), similar to antihypertensive medications (Captopril, Lisinopril, Perindopril, etc.). Besides, some peptides in rice may increase NO release (1.2).
According to studies, potato consumption may improve lipid profiles and decrease markers of inflammation. Regarding rice, these effects are unknown (3).
There is no evidence linking higher white rice consumption to a higher risk of stroke or coronary artery disease. However, in some populations, eating white rice may be linked to a higher risk of developing metabolic syndrome (4).
Diabetes
In light of research findings, heightened consumption of potatoes is potentially associated with an increased risk of type 2 diabetes. Nevertheless, this risk can be tempered through thoughtful dietary decisions, like opting for whole grains over potatoes (5).
Similarly, white rice consumption has shown a positive correlation with the risk of diabetes development. To mitigate this risk, experts recommend substituting white rice with brown rice, which offers a more favorable nutritional profile (6).
Digestive Health
Regarding fiber content, mashed potatoes, exceptionally if prepared from peeled potatoes, generally contain less fiber than whole potatoes with the skin. Fiber is pivotal in maintaining a healthy digestive system by promoting regular bowel movements and preventing constipation. However, mashed potatoes might be fiberless unless prepared with unpeeled potatoes or supplemented with high-fiber ingredients.
An interesting phenomenon occurs with potatoes known as retrogradation when they are cooked and cooled. This process leads to the development of resistant starch, which acts as a prebiotic that fosters the growth of beneficial gut bacteria. Regrettably, mashing potatoes and consuming them immediately after cooking limits resistant starch formation (7).
In contrast, white rice is recognized for its relatively low dietary fiber content, making it suitable for those with diarrhea. While both white and brown rice are generally tolerable for individuals with irritable bowel syndrome (IBS), only white rice is deemed safe during inflammatory bowel disease (IBD) episodes, including Crohn's disease and ulcerative colitis (8.9).
Notably, brown rice, a commendable dietary fiber source, holds potential benefits. Dietary fiber is acknowledged for its ability to alleviate chronic constipation symptoms and reduce the risk of gastrointestinal conditions such as gastroesophageal reflux disease (GERD), duodenal ulcers, diverticulitis, hemorrhoids, and colon cancer (10).
Cancer
Acrylamide, an amine carcinogen, has drawn attention to potatoes, especially in cooked carbohydrate-rich diets like several potato dishes. Concerns regarding their possible consequences for cancer have been raised as a result (11).
However, despite being a mainstay, rice is known to contain the hazardous element arsenic. Several studies show no conclusive links between eating rice and the risk of developing cancer (12).
Downsides and Risks
Many foods contain tiny levels of arsenic, but these concentrations are not harmful. However, it is possible to get mass-produced rice with higher than usual arsenic levels. These are mainly caused by contaminated soil and water close to industrial sources. Concentrations of arsenic can cause several harmful side effects, including congenital disabilities during pregnancy, neurological illnesses, metabolic abnormalities, and diabetes (13).
Video Summary
Sources
- https://www.sciencedirect.com/science/article/pii/S2213453022000945
- https://www.sciencedirect.com/science/article/abs/pii/S1756464616301372
- https://www.tandfonline.com/doi/full/10.3109/07853890.2013.813633
- https://www.ncbi.nlm.nih.gov/pmc/articles/PMC5818041/
- https://diabetesjournals.org/care/article/39/3/376/37170/Potato-Consumption-and-Risk-of-Type-2-Diabetes
- https://pubmed.ncbi.nlm.nih.gov/22422870/
- https://www.sciencedirect.com/science/article/abs/pii/0308814695928288
- https://www.mdpi.com/2072-6643/14/22/4775
- https://www.mdpi.com/2072-6643/14/12/2469
- https://pubmed.ncbi.nlm.nih.gov/24876314/
- https://academic.oup.com/carcin/article/27/12/2367/2476298
- https://pubmed.ncbi.nlm.nih.gov/26219234/
- https://www.ncbi.nlm.nih.gov/pmc/articles/PMC5502079/

Infographic
All nutrients comparison - raw data values
| Nutrient | |
|
DV% diff. |
| Manganese | 0.472mg | 0.098mg | 16% |
| Sodium | 1mg | 306mg | 13% |
| Selenium | 7.5µg | 0.8µg | 12% |
| Vitamin B1 | 0.163mg | 0.015mg | 12% |
| Folate | 58µg | 9µg | 12% |
| Iron | 1.2mg | 0.31mg | 11% |
| Vitamin B5 | 0.39mg | 8% | |
| Polyunsaturated fat | 0.076g | 1.342g | 8% |
| Potassium | 35mg | 286mg | 7% |
| Carbs | 28.17g | 14.65g | 5% |
| Starch | 12.1g | 5% | |
| Vitamin A | 0µg | 43µg | 5% |
| Vitamin K | 0µg | 5.9µg | 5% |
| Fats | 0.28g | 2.82g | 4% |
| Fiber | 0.4g | 1.3g | 4% |
| Copper | 0.069mg | 0.035mg | 4% |
| Vitamin E | 0.04mg | 0.42mg | 3% |
| Vitamin B12 | 0µg | 0.07µg | 3% |
| Calories | 130kcal | 89kcal | 2% |
| Protein | 2.69g | 1.65g | 2% |
| Zinc | 0.49mg | 0.22mg | 2% |
| Phosphorus | 43mg | 59mg | 2% |
| Vitamin B3 | 1.476mg | 1.08mg | 2% |
| Vitamin B6 | 0.093mg | 0.12mg | 2% |
| Choline | 2.1mg | 13.4mg | 2% |
| Saturated fat | 0.077g | 0.577g | 2% |
| Monounsaturated fat | 0.088g | 0.72g | 2% |
| Magnesium | 12mg | 15mg | 1% |
| Calcium | 10mg | 18mg | 1% |
| Net carbs | 27.77g | 13.35g | N/A |
| Sugar | 0.05g | 0.5g | N/A |
| Vitamin B2 | 0.013mg | 0.015mg | 0% |
| Trans fat | 0.105g | N/A | |
| Tryptophan | 0.031mg | 0% | |
| Threonine | 0.096mg | 0% | |
| Isoleucine | 0.116mg | 0% | |
| Leucine | 0.222mg | 0% | |
| Lysine | 0.097mg | 0% | |
| Methionine | 0.063mg | 0% | |
| Phenylalanine | 0.144mg | 0% | |
| Valine | 0.164mg | 0% | |
| Histidine | 0.063mg | 0% | |
| Fructose | 0.2g | 0% | |
| Omega-3 - EPA | 0g | 0.001g | N/A |
| Omega-3 - ALA | 0.174g | N/A | |
| Omega-3 - DPA | 0g | 0.001g | N/A |
| Omega-6 - Eicosadienoic acid | 0.001g | N/A | |
| Omega-6 - Linoleic acid | 1.146g | N/A |
People also compare


References
All the values for which the sources are not specified explicitly are taken from FDA’s Food Central. The exact link to the food presented on this page can be found below.
- Rice - https://fdc.nal.usda.gov/fdc-app.html#/food-details/168878/nutrients
- Mashed potato - https://fdc.nal.usda.gov/fdc-app.html#/food-details/170699/nutrients
All the Daily Values are presented for males aged 31-50, for 2000-calorie diets.