Rockstar vs. V8 juice — In-Depth Nutrition Comparison
Compare
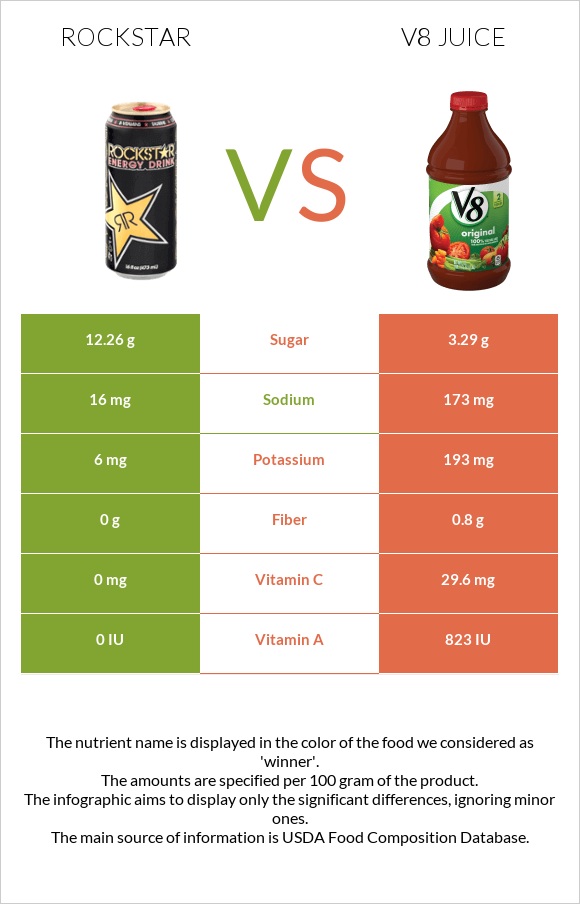
What are the differences between Rockstar and v8 juice?
- The amount of vitamin C, vitamin A, and potassium in v8 juice is higher than in Rockstar.
- V8 juice's daily need coverage for vitamin C is 33% more.
- V8 juice contains 4 times less sugar than Rockstar. Rockstar contains 12.26g of sugar, while v8 juice contains 3.29g.
We used Beverages, Energy drink, ROCKSTAR and CAMPBELL'S, V8 100% Vegetable Juice types in this article.
Infographic
Infographic link
Mineral Comparison
Mineral comparison score is based on the number of minerals by which one or the other food is richer. The "coverage" charts below show how much of the daily needs can be covered by 300 grams of the food.
| Contains more ZincZinc | +∞% |
| Contains less SodiumSodium | -90.8% |
| Contains more CalciumCalcium | +1500% |
| Contains more PotassiumPotassium | +3116.7% |
| Contains more IronIron | +500% |
Vitamin Comparison
Vitamin comparison score is based on the number of vitamins by which one or the other food is richer. The "coverage" charts below show how much of the daily needs can be covered by 300 grams of the food.
| Contains more Vitamin B2Vitamin B2 | +∞% |
| Contains more Vitamin B3Vitamin B3 | +∞% |
| Contains more Vitamin B5Vitamin B5 | +∞% |
| Contains more Vitamin B6Vitamin B6 | +∞% |
| Contains more Vitamin B12Vitamin B12 | +∞% |
| Contains more Vitamin CVitamin C | +∞% |
All nutrients comparison - raw data values
| Nutrient |  |
 |
DV% diff. |
| Vitamin B12 | 3.77µg | 157% | |
| Vitamin B2 | 1.6mg | 123% | |
| Vitamin B6 | 1.353mg | 104% | |
| Vitamin B5 | 4.167mg | 83% | |
| Vitamin B3 | 9.82mg | 61% | |
| Vitamin C | 0mg | 29.6mg | 33% |
| Caffeine | 33mg | 8% | |
| Sodium | 16mg | 173mg | 7% |
| Potassium | 6mg | 193mg | 6% |
| Fructose | 3.59g | 4% | |
| Carbs | 12.7g | 4.12g | 3% |
| Iron | 0.05mg | 0.3mg | 3% |
| Fiber | 0g | 0.8g | 3% |
| Calories | 58kcal | 21kcal | 2% |
| Calcium | 1mg | 16mg | 2% |
| Protein | 0.34g | 0.82g | 1% |
| Fats | 0.22g | 0g | 0% |
| Net carbs | 12.7g | 3.32g | N/A |
| Sugar | 12.26g | 3.29g | N/A |
| Zinc | 0.05mg | 0% | |
| Choline | 0.3mg | 0% |
Macronutrient Comparison
Macronutrient breakdown side-by-side comparison
| Contains more FatsFats | +∞% |
| Contains more CarbsCarbs | +208.3% |
| Contains more ProteinProtein | +141.2% |
| Contains more OtherOther | +∞% |
~equal in
Water
~93.9g


