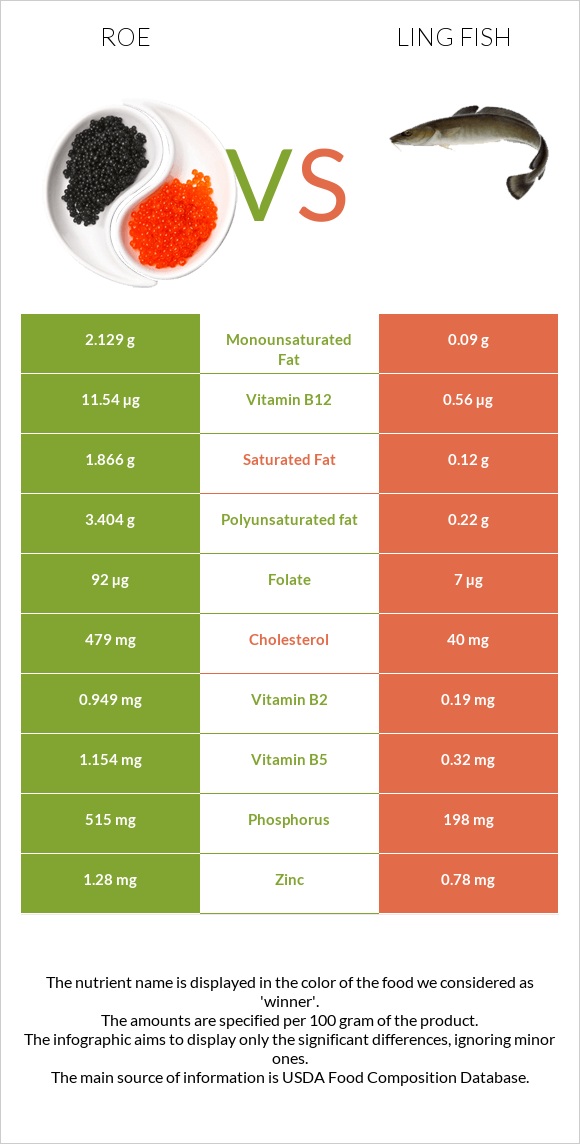
A recap on the differences between roe and ling fish Roe is higher in vitamin B12, vitamin B2, phosphorus, folate, vitamin C, vitamin B5, and vitamin B1, yet ling fish is higher in magnesium and vitamin B6. Roe covers your daily vitamin B12 needs 454% more than ling fish. The amount of cholesterol in ling fish is lower. The glycemic index of ling fish is lower. Food varieties used in this article are Fish, roe, mixed species, cooked, dry heat and Fish, ling, cooked, dry heat .
Infographic
Mineral Comparison
Mineral comparison score is based on the number of minerals by which one or the other food is richer. The "coverage" charts below show how much of the daily needs can be covered by 300 grams of the food.
3
100 g
300 g
1 oz - 28.35g 3 oz - 85g
Magnesium
Magnesium
Calcium
Calcium
Potassium
Potassium
Iron
Iron
Copper
Copper
Zinc
Zinc
Phosphorus
Phosphorus
Sodium
Sodium
Manganese
Manganese
Selenium
Selenium
19%
8.4%
25%
29%
43%
35%
221%
15%
1.7%
282%
5
100 g
300 g
3 oz - 85g 1 fillet - 151g
Magnesium
Magnesium
Calcium
Calcium
Potassium
Potassium
Iron
Iron
Copper
Copper
Zinc
Zinc
Phosphorus
Phosphorus
Sodium
Sodium
Manganese
Manganese
Selenium
Selenium
58%
13%
43%
31%
47%
27%
109%
23%
5%
255%
Vitamin Comparison
Vitamin comparison score is based on the number of vitamins by which one or the other food is richer. The "coverage" charts below show how much of the daily needs can be covered by 300 grams of the food.
7
100 g
300 g
1 oz - 28.35g 3 oz - 85g
Vitamin C
Vit. C
Vitamin D
Vit. D
Vitamin A
Vit. A
Vitamin E
Vit. E
Vitamin B1
Vit. B1
Vitamin B2
Vit. B2
Vitamin B3
Vit. B3
Vitamin B5
Vit. B5
Vitamin B6
Vit. B6
Vitamin B12
Vit. B12
Vitamin K
Vit. K
Folate
Folate
55%
0%
30%
0%
69%
219%
41%
69%
43%
1443%
0%
69%
2
100 g
300 g
3 oz - 85g 1 fillet - 151g
Vitamin C
Vit. C
Vitamin D
Vit. D
Vitamin A
Vit. A
Vitamin E
Vit. E
Vitamin B1
Vit. B1
Vitamin B2
Vit. B2
Vitamin B3
Vit. B3
Vitamin B5
Vit. B5
Vitamin B6
Vit. B6
Vitamin B12
Vit. B12
Vitamin K
Vit. K
Folate
Folate
0%
0%
12%
0%
32%
53%
53%
22%
81%
81%
0%
6%
All nutrients comparison - raw data values
Nutrient
DV% diff.
Vitamin B12
11.54µg
0.65µg
454%
Cholesterol
479mg
51mg
143%
Vitamin B2
0.949mg
0.231mg
55%
Phosphorus
515mg
254mg
37%
Polyunsaturated fat
3.404g
23%
Folate
92µg
8µg
21%
Vitamin C
16.4mg
0mg
18%
Vitamin B5
1.154mg
0.369mg
16%
Magnesium
26mg
81mg
13%
Vitamin B1
0.277mg
0.127mg
13%
Vitamin B6
0.185mg
0.351mg
13%
Fats
8.23g
0.82g
11%
Protein
28.62g
24.35g
9%
Selenium
51.7µg
46.8µg
9%
Saturated fat
1.866g
8%
Potassium
283mg
486mg
6%
Vitamin A
91µg
35µg
6%
Calories
204kcal
111kcal
5%
Monounsaturated fat
2.129g
5%
Vitamin B3
2.192mg
2.801mg
4%
Zinc
1.28mg
1mg
3%
Calcium
28mg
44mg
2%
Sodium
117mg
173mg
2%
Carbs
1.92g
0g
1%
Iron
0.77mg
0.83mg
1%
Copper
0.128mg
0.141mg
1%
Manganese
0.013mg
0.038mg
1%
Protein per 100 calories
14g
22g
N/A
Calories per 10 g protein
71kcal
46kcal
N/A
Weight per 100 calories
49g
90g
N/A
Unsaturated / Saturated Fat ratio
3
N/A
Net carbs
1.92g
0g
N/A
Tryptophan
0.375mg
0.273mg
0%
Threonine
1.305mg
1.067mg
0%
Isoleucine
1.465mg
1.122mg
0%
Leucine
2.509mg
1.979mg
0%
Lysine
2.179mg
2.236mg
0%
Methionine
0.71mg
0.721mg
0%
Phenylalanine
1.401mg
0.95mg
0%
Valine
1.676mg
1.254mg
0%
Histidine
0.778mg
0.717mg
0%
Omega-3 - EPA
1.26g
N/A
Omega-3 - DHA
1.747g
N/A
Omega-3 - DPA
0.105g
N/A
Macronutrient Comparison
Macronutrient breakdown side-by-side comparison
4
29%
8%
2%
59%
3%
Protein:
28.62 g
Fats:
8.23 g
Carbs:
1.92 g
Water:
58.63 g
Other:
2.6 g
1
24%
74%
Protein:
24.35 g
Fats:
0.82 g
Carbs:
0 g
Water:
73.88 g
Other:
0.95 g
Contains
more
Protein Protein
+17.5%
Contains
more
Fats Fats
+903.7%
Contains
more
Carbs Carbs
+∞%
Contains
more
Other Other
+173.7%
Contains
more
Water Water
+26%