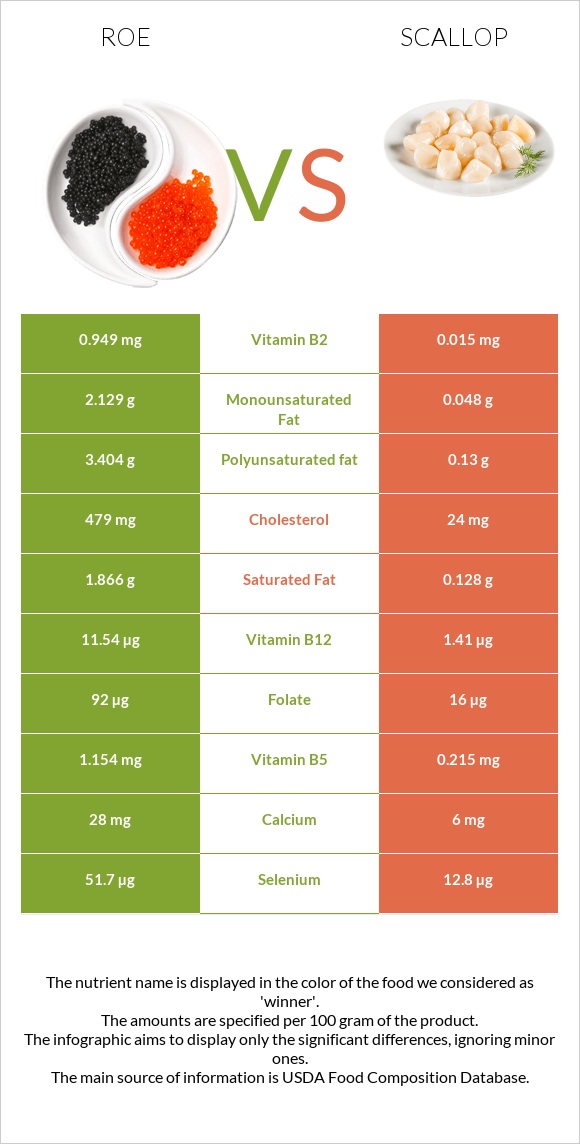
What are the differences between roe and scallops? Roe is richer than scallops in vitamin B12, vitamin B2, selenium, vitamin B1, vitamin C, folate, vitamin B5, and phosphorus. Roe's daily need coverage for vitamin B12 is 391% more. The amount of cholesterol in scallops is lower. We used Fish, roe, mixed species, cooked, dry heat and Mollusks, scallop, (bay and sea), cooked, steamed types in this article.
Infographic
Mineral Comparison
Mineral comparison score is based on the number of minerals by which one or the other food is richer. The "coverage" charts below show how much of the daily needs can be covered by 300 grams of the food.
6
100 g
300 g
1 oz - 28.35g 3 oz - 85g
Magnesium
Magnesium
Calcium
Calcium
Potassium
Potassium
Iron
Iron
Copper
Copper
Zinc
Zinc
Phosphorus
Phosphorus
Sodium
Sodium
Manganese
Manganese
Selenium
Selenium
19%
8.4%
25%
29%
43%
35%
221%
15%
1.7%
282%
4
100 g
300 g
3 oz - 85g
Magnesium
Magnesium
Calcium
Calcium
Potassium
Potassium
Iron
Iron
Copper
Copper
Zinc
Zinc
Phosphorus
Phosphorus
Sodium
Sodium
Manganese
Manganese
Selenium
Selenium
26%
3%
28%
22%
11%
42%
183%
87%
3.8%
118%
Vitamin Comparison
Vitamin comparison score is based on the number of vitamins by which one or the other food is richer. The "coverage" charts below show how much of the daily needs can be covered by 300 grams of the food.
9
100 g
300 g
1 oz - 28.35g 3 oz - 85g
Vitamin C
Vit. C
Vitamin D
Vit. D
Vitamin A
Vit. A
Vitamin E
Vit. E
Vitamin B1
Vit. B1
Vitamin B2
Vit. B2
Vitamin B3
Vit. B3
Vitamin B5
Vit. B5
Vitamin B6
Vit. B6
Vitamin B12
Vit. B12
Vitamin K
Vit. K
Folate
Folate
55%
0%
30%
0%
69%
219%
41%
69%
43%
1443%
0%
69%
0
100 g
300 g
3 oz - 85g
Vitamin C
Vit. C
Vitamin D
Vit. D
Vitamin A
Vit. A
Vitamin E
Vit. E
Vitamin B1
Vit. B1
Vitamin B2
Vit. B2
Vitamin B3
Vit. B3
Vitamin B5
Vit. B5
Vitamin B6
Vit. B6
Vitamin B12
Vit. B12
Vitamin K
Vit. K
Folate
Folate
0%
0%
0.67%
0%
3%
5.5%
20%
22%
26%
269%
0%
15%
All nutrients comparison - raw data values
Nutrient
DV% diff.
Vitamin B12
11.54µg
2.15µg
391%
Cholesterol
479mg
41mg
146%
Vitamin B2
0.949mg
0.024mg
71%
Selenium
51.7µg
21.7µg
55%
Sodium
117mg
667mg
24%
Vitamin B1
0.277mg
0.012mg
22%
Polyunsaturated fat
3.404g
0.222g
21%
Choline
110.7mg
20%
Vitamin C
16.4mg
0mg
18%
Folate
92µg
20µg
18%
Protein
28.62g
20.54g
16%
Vitamin B5
1.154mg
0.366mg
16%
Phosphorus
515mg
426mg
13%
Fats
8.23g
0.84g
11%
Copper
0.128mg
0.033mg
11%
Vitamin A
91µg
2µg
10%
Vitamin B3
2.192mg
1.076mg
7%
Saturated fat
1.866g
0.218g
7%
Vitamin B6
0.185mg
0.112mg
6%
Calories
204kcal
111kcal
5%
Monounsaturated fat
2.129g
0.082g
5%
Magnesium
26mg
37mg
3%
Calcium
28mg
10mg
2%
Iron
0.77mg
0.58mg
2%
Zinc
1.28mg
1.55mg
2%
Starch
3.69g
2%
Carbs
1.92g
5.41g
1%
Potassium
283mg
314mg
1%
Manganese
0.013mg
0.029mg
1%
Protein per 100 calories
14g
19g
N/A
Calories per 10 g protein
71kcal
54kcal
N/A
Weight per 100 calories
49g
90g
N/A
Unsaturated / Saturated Fat ratio
3
1.4
N/A
Net carbs
1.92g
5.41g
N/A
Vitamin D*
2 IU
0%
Trans fat
0.009g
N/A
Tryptophan
0.375mg
0.173mg
0%
Threonine
1.305mg
0.629mg
0%
Isoleucine
1.465mg
0.692mg
0%
Leucine
2.509mg
1.226mg
0%
Lysine
2.179mg
1.258mg
0%
Methionine
0.71mg
0.487mg
0%
Phenylalanine
1.401mg
0.597mg
0%
Valine
1.676mg
0.645mg
0%
Histidine
0.778mg
0.314mg
0%
Omega-3 - EPA
1.26g
0.072g
N/A
Omega-3 - DHA
1.747g
0.104g
N/A
Omega-3 - DPA
0.105g
0.005g
N/A
Omega-6 - Eicosadienoic acid
0.002g
N/A
Macronutrient Comparison
Macronutrient breakdown side-by-side comparison
2
29%
8%
2%
59%
3%
Protein:
28.62 g
Fats:
8.23 g
Carbs:
1.92 g
Water:
58.63 g
Other:
2.6 g
3
21%
5%
70%
3%
Protein:
20.54 g
Fats:
0.84 g
Carbs:
5.41 g
Water:
70.25 g
Other:
2.96 g
Contains
more
Protein Protein
+39.3%
Contains
more
Fats Fats
+879.8%
Contains
more
Carbs Carbs
+181.8%
Contains
more
Water Water
+19.8%
Contains
more
Other Other
+13.8%
Fat Type Comparison
Fat type breakdown side-by-side comparison
2
25%
29%
46%
Saturated fat:
Sat. Fat
1.866 g
Monounsaturated fat:
Mono. Fat
2.129 g
Polyunsaturated fat:
Poly. Fat
3.404 g
1
42%
16%
43%
Saturated fat:
Sat. Fat
0.218 g
Monounsaturated fat:
Mono. Fat
0.082 g
Polyunsaturated fat:
Poly. Fat
0.222 g
Contains
more
Mono. Fat Monounsaturated fat
+2496.3%
Contains
more
Poly. Fat Polyunsaturated fat
+1433.3%
Contains
less
Sat. Fat Saturated fat
-88.3%