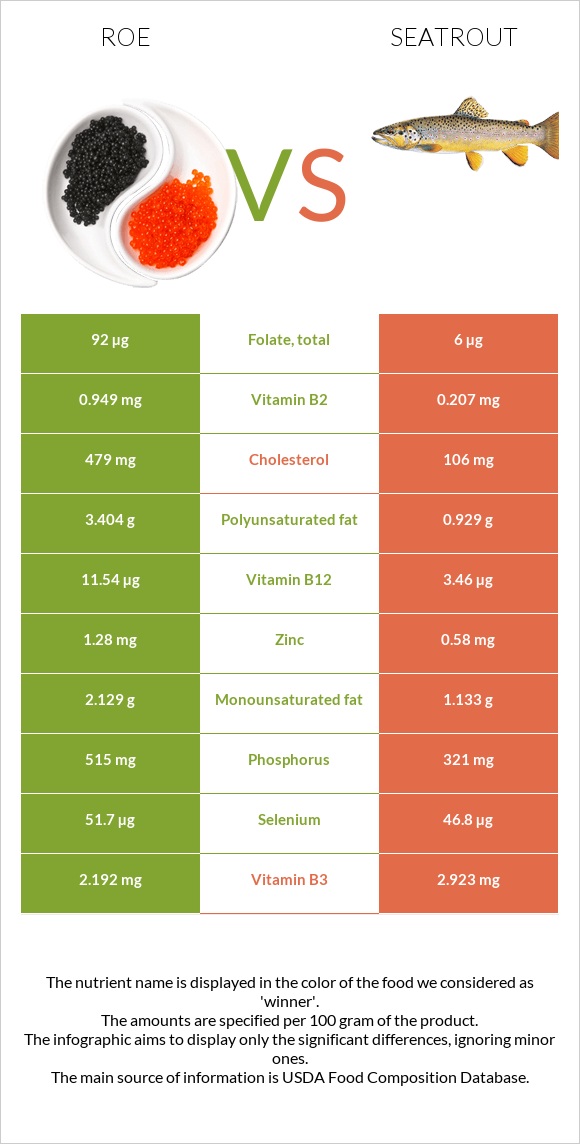
Differences between roe and seatrout Roe has more vitamin B12, vitamin B2, phosphorus, folate, vitamin C, vitamin B1, copper, and selenium, while seatrout has more vitamin B6. Roe's daily need coverage for vitamin B12 is 337% higher. The amount of cholesterol in seatrout is lower. Seatrout has a lower glycemic index. The glycemic index of seatrout is 0, while the glycemic index of roe is 27. The food types used in this comparison are Fish, roe, mixed species, cooked, dry heat and Fish, seatrout, mixed species, cooked, dry heat .
Infographic
Mineral Comparison
Mineral comparison score is based on the number of minerals by which one or the other food is richer. The "coverage" charts below show how much of the daily needs can be covered by 300 grams of the food.
5
100 g
300 g
1 oz - 28.35g 3 oz - 85g
Magnesium
Magnesium
Calcium
Calcium
Potassium
Potassium
Iron
Iron
Copper
Copper
Zinc
Zinc
Phosphorus
Phosphorus
Sodium
Sodium
Manganese
Manganese
Selenium
Selenium
19%
8.4%
25%
29%
43%
35%
221%
15%
1.7%
282%
4
100 g
300 g
3 oz - 85g 1 fillet - 186g
Magnesium
Magnesium
Calcium
Calcium
Potassium
Potassium
Iron
Iron
Copper
Copper
Zinc
Zinc
Phosphorus
Phosphorus
Sodium
Sodium
Manganese
Manganese
Selenium
Selenium
29%
6.6%
39%
13%
13%
16%
138%
9.7%
2.5%
255%
Vitamin Comparison
Vitamin comparison score is based on the number of vitamins by which one or the other food is richer. The "coverage" charts below show how much of the daily needs can be covered by 300 grams of the food.
7
100 g
300 g
1 oz - 28.35g 3 oz - 85g
Vitamin C
Vit. C
Vitamin D
Vit. D
Vitamin A
Vit. A
Vitamin E
Vit. E
Vitamin B1
Vit. B1
Vitamin B2
Vit. B2
Vitamin B3
Vit. B3
Vitamin B5
Vit. B5
Vitamin B6
Vit. B6
Vitamin B12
Vit. B12
Vitamin K
Vit. K
Folate
Folate
55%
0%
30%
0%
69%
219%
41%
69%
43%
1443%
0%
69%
2
100 g
300 g
3 oz - 85g 1 fillet - 186g
Vitamin C
Vit. C
Vitamin D
Vit. D
Vitamin A
Vit. A
Vitamin E
Vit. E
Vitamin B1
Vit. B1
Vitamin B2
Vit. B2
Vitamin B3
Vit. B3
Vitamin B5
Vit. B5
Vitamin B6
Vit. B6
Vitamin B12
Vit. B12
Vitamin K
Vit. K
Folate
Folate
0%
0%
12%
0%
17%
48%
55%
52%
107%
433%
0%
4.5%
All nutrients comparison - raw data values
Nutrient
DV% diff.
Vitamin B12
11.54µg
3.46µg
337%
Cholesterol
479mg
106mg
124%
Vitamin B2
0.949mg
0.207mg
57%
Phosphorus
515mg
321mg
28%
Folate
92µg
6µg
22%
Vitamin B6
0.185mg
0.462mg
21%
Vitamin C
16.4mg
0mg
18%
Vitamin B1
0.277mg
0.069mg
17%
Polyunsaturated fat
3.404g
0.929g
17%
Protein
28.62g
21.46g
14%
Copper
0.128mg
0.038mg
10%
Selenium
51.7µg
46.8µg
9%
Fats
8.23g
4.63g
6%
Zinc
1.28mg
0.58mg
6%
Vitamin A
91µg
35µg
6%
Vitamin B5
1.154mg
0.865mg
6%
Potassium
283mg
437mg
5%
Iron
0.77mg
0.35mg
5%
Vitamin B3
2.192mg
2.923mg
5%
Calories
204kcal
133kcal
4%
Magnesium
26mg
40mg
3%
Saturated fat
1.866g
1.293g
3%
Sodium
117mg
74mg
2%
Monounsaturated fat
2.129g
1.133g
2%
Carbs
1.92g
0g
1%
Calcium
28mg
22mg
1%
Protein per 100 calories
14g
16g
N/A
Calories per 10 g protein
71kcal
62kcal
N/A
Weight per 100 calories
49g
75g
N/A
Unsaturated / Saturated Fat ratio
3
1.6
N/A
Net carbs
1.92g
0g
N/A
Manganese
0.013mg
0.019mg
0%
Tryptophan
0.375mg
0.24mg
0%
Threonine
1.305mg
0.941mg
0%
Isoleucine
1.465mg
0.989mg
0%
Leucine
2.509mg
1.744mg
0%
Lysine
2.179mg
1.971mg
0%
Methionine
0.71mg
0.635mg
0%
Phenylalanine
1.401mg
0.838mg
0%
Valine
1.676mg
1.106mg
0%
Histidine
0.778mg
0.632mg
0%
Omega-3 - EPA
1.26g
0.211g
N/A
Omega-3 - DHA
1.747g
0.265g
N/A
Omega-3 - DPA
0.105g
0.097g
N/A
Macronutrient Comparison
Macronutrient breakdown side-by-side comparison
4
29%
8%
2%
59%
3%
Protein:
28.62 g
Fats:
8.23 g
Carbs:
1.92 g
Water:
58.63 g
Other:
2.6 g
1
21%
5%
72%
2%
Protein:
21.46 g
Fats:
4.63 g
Carbs:
0 g
Water:
71.91 g
Other:
2 g
Contains
more
Protein Protein
+33.4%
Contains
more
Fats Fats
+77.8%
Contains
more
Carbs Carbs
+∞%
Contains
more
Other Other
+30%
Contains
more
Water Water
+22.7%
Fat Type Comparison
Fat type breakdown side-by-side comparison
2
25%
29%
46%
Saturated fat:
Sat. Fat
1.866 g
Monounsaturated fat:
Mono. Fat
2.129 g
Polyunsaturated fat:
Poly. Fat
3.404 g
1
39%
34%
28%
Saturated fat:
Sat. Fat
1.293 g
Monounsaturated fat:
Mono. Fat
1.133 g
Polyunsaturated fat:
Poly. Fat
0.929 g
Contains
more
Mono. Fat Monounsaturated fat
+87.9%
Contains
more
Poly. Fat Polyunsaturated fat
+266.4%
Contains
less
Sat. Fat Saturated fat
-30.7%