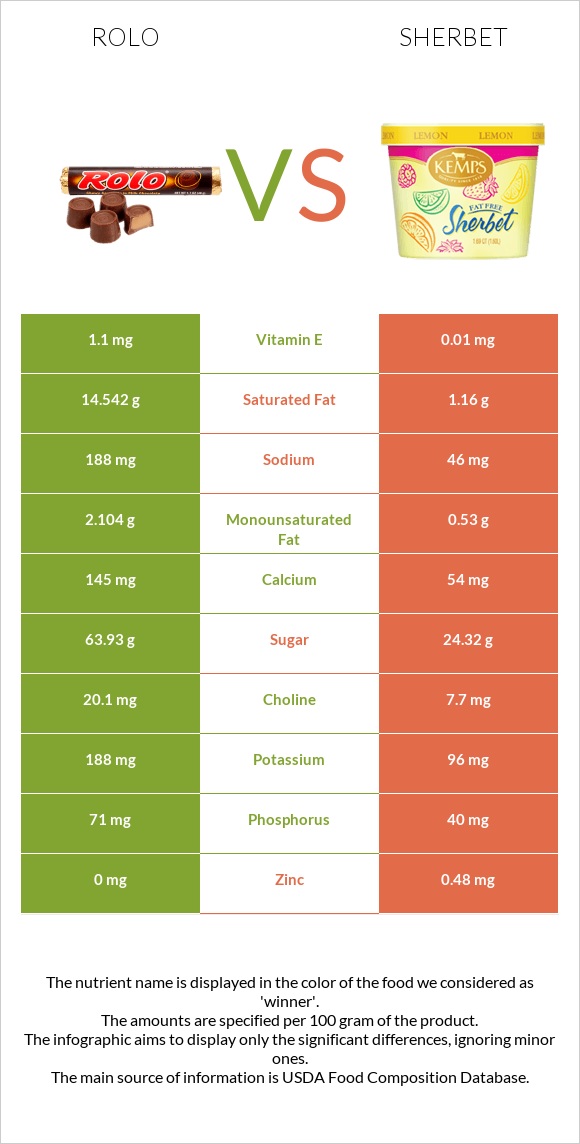
How are rolo and sherbet different? Rolo has more calcium, vitamin B12, and vitamin E than sherbet. Daily need coverage for saturated fat for rolo is 67% higher. Rolo contains 110 times more vitamin E than sherbet. While rolo contains 1.1mg of vitamin E, sherbet contains only 0.01mg. Sherbet has less saturated fat. Candies, ROLO Caramels in Milk Chocolate and Sherbet, orange are the varieties used in this article.
Infographic
Mineral Comparison
Mineral comparison score is based on the number of minerals by which one or the other food is richer. The "coverage" charts below show how much of the daily needs can be covered by 300 grams of the food.
4
100 g
300 g
7 pieces - 42g 1 package 1 package - 48g
Magnesium
Magnesium
Calcium
Calcium
Potassium
Potassium
Iron
Iron
Copper
Copper
Zinc
Zinc
Phosphorus
Phosphorus
Sodium
Sodium
Manganese
Manganese
Selenium
Selenium
0%
44%
17%
16%
0%
0%
30%
25%
0%
0%
6
100 g
300 g
1 bar (2.75 fl oz) - 66g 0.5 cup (4 fl oz) - 74g
Magnesium
Magnesium
Calcium
Calcium
Potassium
Potassium
Iron
Iron
Copper
Copper
Zinc
Zinc
Phosphorus
Phosphorus
Sodium
Sodium
Manganese
Manganese
Selenium
Selenium
5.7%
16%
8.5%
5.3%
9.3%
13%
17%
6%
1.4%
8.2%
Vitamin Comparison
Vitamin comparison score is based on the number of vitamins by which one or the other food is richer. The "coverage" charts below show how much of the daily needs can be covered by 300 grams of the food.
5
100 g
300 g
7 pieces - 42g 1 package 1 package - 48g
Vitamin C
Vit. C
Vitamin D
Vit. D
Vitamin A
Vit. A
Vitamin E
Vit. E
Vitamin B1
Vit. B1
Vitamin B2
Vit. B2
Vitamin B3
Vit. B3
Vitamin B5
Vit. B5
Vitamin B6
Vit. B6
Vitamin B12
Vit. B12
Vitamin K
Vit. K
Folate
Folate
3%
0%
11%
22%
5%
28%
0.75%
0%
0%
41%
8%
0%
6
100 g
300 g
1 bar (2.75 fl oz) - 66g 0.5 cup (4 fl oz) - 74g
Vitamin C
Vit. C
Vitamin D
Vit. D
Vitamin A
Vit. A
Vitamin E
Vit. E
Vitamin B1
Vit. B1
Vitamin B2
Vit. B2
Vitamin B3
Vit. B3
Vitamin B5
Vit. B5
Vitamin B6
Vit. B6
Vitamin B12
Vit. B12
Vitamin K
Vit. K
Folate
Folate
7.7%
0%
4%
0.2%
6.8%
22%
1.2%
13%
5.3%
16%
0%
3%
All nutrients comparison - raw data values
Nutrient
DV% diff.
Saturated fat
14.542g
1.16g
61%
Fats
20.93g
2g
29%
Calories
474kcal
144kcal
17%
Carbs
67.95g
30.4g
13%
Calcium
145mg
54mg
9%
Protein
5.08g
1.1g
8%
Vitamin B12
0.33µg
0.13µg
8%
Vitamin E
1.1mg
0.01mg
7%
Sodium
188mg
46mg
6%
Cholesterol
12mg
1mg
4%
Iron
0.42mg
0.14mg
4%
Zinc
0mg
0.48mg
4%
Phosphorus
71mg
40mg
4%
Vitamin B5
0mg
0.224mg
4%
Monounsaturated fat
2.104g
0.53g
4%
Potassium
188mg
96mg
3%
Copper
0mg
0.028mg
3%
Selenium
0µg
1.5µg
3%
Vitamin K
3.2µg
0µg
3%
Vitamin C
0.9mg
2.3mg
2%
Magnesium
0mg
8mg
2%
Fiber
0.9g
1.3g
2%
Vitamin A
34µg
12µg
2%
Vitamin B2
0.12mg
0.097mg
2%
Vitamin B6
0mg
0.023mg
2%
Choline
20.1mg
7.7mg
2%
Caffeine
6mg
0mg
2%
Vitamin B1
0.02mg
0.027mg
1%
Folate
0µg
4µg
1%
Polyunsaturated fat
0.265g
0.08g
1%
Protein per 100 calories
1.1g
0.76g
N/A
Calories per 10 g protein
933kcal
1309kcal
N/A
Weight per 100 calories
21g
69g
N/A
Unsaturated / Saturated Fat ratio
0.16
0.53
N/A
Net carbs
67.05g
29.1g
N/A
Sugar
63.93g
24.32g
N/A
Manganese
0mg
0.011mg
0%
Vitamin B3
0.04mg
0.063mg
0%
Macronutrient Comparison
Macronutrient breakdown side-by-side comparison
4
5%
21%
68%
5%
Protein:
5.08 g
Fats:
20.93 g
Carbs:
67.95 g
Water:
4.6 g
Other:
1.44 g
1
2%
30%
66%
Protein:
1.1 g
Fats:
2 g
Carbs:
30.4 g
Water:
66.1 g
Other:
0.4 g
Contains
more
Protein Protein
+361.8%
Contains
more
Fats Fats
+946.5%
Contains
more
Carbs Carbs
+123.5%
Contains
more
Other Other
+260%
Contains
more
Water Water
+1337%
Fat Type Comparison
Fat type breakdown side-by-side comparison
2
86%
12%
Saturated fat:
Sat. Fat
14.542 g
Monounsaturated fat:
Mono. Fat
2.104 g
Polyunsaturated fat:
Poly. Fat
0.265 g
1
66%
30%
5%
Saturated fat:
Sat. Fat
1.16 g
Monounsaturated fat:
Mono. Fat
0.53 g
Polyunsaturated fat:
Poly. Fat
0.08 g
Contains
more
Mono. Fat Monounsaturated fat
+297%
Contains
more
Poly. Fat Polyunsaturated fat
+231.3%
Contains
less
Sat. Fat Saturated fat
-92%