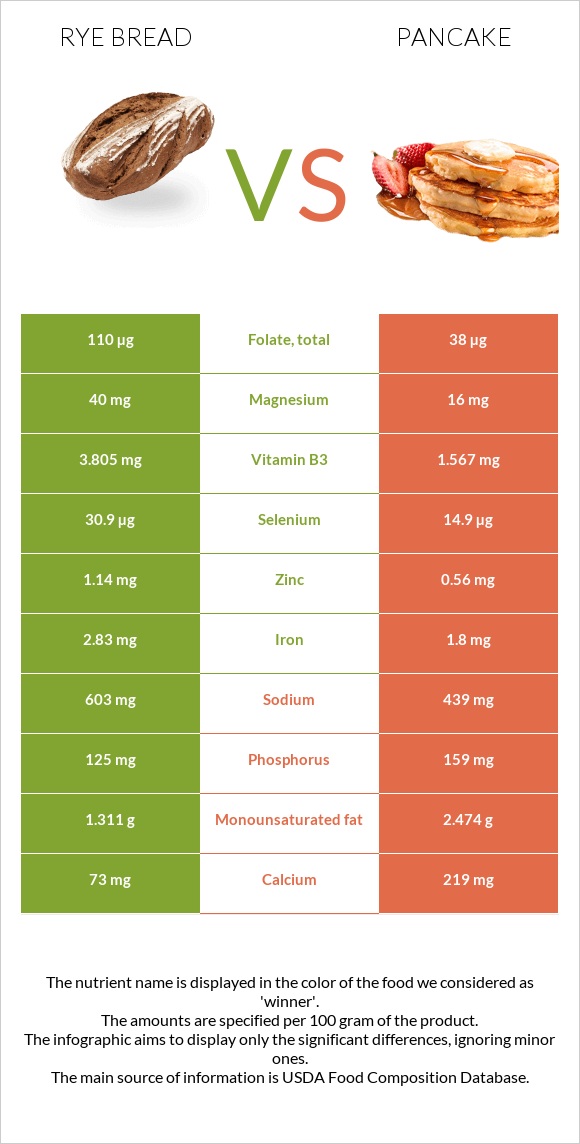
Summary of differences between rye bread and pancake Rye bread has more selenium, manganese, vitamin B1, folate, copper, vitamin B3, and iron, while pancake has more calcium and vitamin B12. Rye bread covers your daily need for selenium, 29% more than pancake. Rye bread contains 4 times more manganese than pancake. While rye bread contains 0.824mg of manganese, pancake contains only 0.2mg. These are the specific foods used in this comparison Bread, rye and Pancakes, plain, prepared from recipe .
Infographic
Mineral Comparison
Mineral comparison score is based on the number of minerals by which one or the other food is richer. The "coverage" charts below show how much of the daily needs can be covered by 300 grams of the food.
7
100 g
300 g
1 slice, snack-size - 7g 1 slice, thin - 25g 1 oz - 28.35g 1 slice, regular - 32g
Magnesium
Magnesium
Calcium
Calcium
Potassium
Potassium
Iron
Iron
Copper
Copper
Zinc
Zinc
Phosphorus
Phosphorus
Sodium
Sodium
Manganese
Manganese
Selenium
Selenium
29%
22%
15%
106%
62%
31%
54%
79%
107%
169%
3
100 g
300 g
1 oz - 28.35g 1 pancake (4" dia) - 38g 1 pancake (6" dia) - 77g
Magnesium
Magnesium
Calcium
Calcium
Potassium
Potassium
Iron
Iron
Copper
Copper
Zinc
Zinc
Phosphorus
Phosphorus
Sodium
Sodium
Manganese
Manganese
Selenium
Selenium
11%
66%
12%
68%
16%
15%
68%
57%
26%
81%
Vitamin Comparison
Vitamin comparison score is based on the number of vitamins by which one or the other food is richer. The "coverage" charts below show how much of the daily needs can be covered by 300 grams of the food.
8
100 g
300 g
1 slice, snack-size - 7g 1 slice, thin - 25g 1 oz - 28.35g 1 slice, regular - 32g
Vitamin C
Vit. C
Vitamin D
Vit. D
Vitamin A
Vit. A
Vitamin E
Vit. E
Vitamin B1
Vit. B1
Vitamin B2
Vit. B2
Vitamin B3
Vit. B3
Vitamin B5
Vit. B5
Vitamin B6
Vit. B6
Vitamin B12
Vit. B12
Vitamin K
Vit. K
Folate
Folate
1.3%
0%
0%
6.6%
109%
77%
71%
26%
17%
0%
3%
83%
2
100 g
300 g
1 oz - 28.35g 1 pancake (4" dia) - 38g 1 pancake (6" dia) - 77g
Vitamin C
Vit. C
Vitamin D
Vit. D
Vitamin A
Vit. A
Vitamin E
Vit. E
Vitamin B1
Vit. B1
Vitamin B2
Vit. B2
Vitamin B3
Vit. B3
Vitamin B5
Vit. B5
Vitamin B6
Vit. B6
Vitamin B12
Vit. B12
Vitamin K
Vit. K
Folate
Folate
1%
0%
18%
0%
50%
65%
29%
24%
11%
28%
0%
29%
All nutrients comparison - raw data values
Nutrient
DV% diff.
Selenium
30.9µg
14.9µg
29%
Manganese
0.824mg
0.2mg
27%
Polyunsaturated fat
0.799g
4.447g
24%
Fiber
5.8g
23%
Cholesterol
0mg
59mg
20%
Vitamin B1
0.434mg
0.201mg
19%
Folate
110µg
38µg
18%
Calcium
73mg
219mg
15%
Copper
0.186mg
0.049mg
15%
Vitamin B3
3.805mg
1.567mg
14%
Iron
2.83mg
1.8mg
13%
Fats
3.3g
9.7g
10%
Vitamin B12
0µg
0.22µg
9%
Carbs
48.3g
28.3g
7%
Sodium
603mg
439mg
7%
Saturated fat
0.626g
2.122g
7%
Magnesium
40mg
16mg
6%
Vitamin A
0µg
54µg
6%
Zinc
1.14mg
0.56mg
5%
Phosphorus
125mg
159mg
5%
Protein
8.5g
6.4g
4%
Vitamin B2
0.335mg
0.281mg
4%
Choline
14.6mg
3%
Monounsaturated fat
1.311g
2.474g
3%
Calories
259kcal
227kcal
2%
Vitamin E
0.33mg
2%
Vitamin B6
0.075mg
0.046mg
2%
Potassium
166mg
132mg
1%
Vitamin B5
0.44mg
0.405mg
1%
Vitamin K
1.2µg
1%
Protein per 100 calories
3.3g
2.8g
N/A
Calories per 10 g protein
305kcal
355kcal
N/A
Weight per 100 calories
39g
44g
N/A
Unsaturated / Saturated Fat ratio
3.4
3.3
N/A
Vitamin C
0.4mg
0.3mg
0%
Net carbs
42.5g
28.3g
N/A
Sugar
3.85g
N/A
Tryptophan
0.096mg
0.08mg
0%
Threonine
0.255mg
0.237mg
0%
Isoleucine
0.319mg
0.297mg
0%
Leucine
0.579mg
0.513mg
0%
Lysine
0.233mg
0.321mg
0%
Methionine
0.139mg
0.147mg
0%
Phenylalanine
0.411mg
0.319mg
0%
Valine
0.379mg
0.335mg
0%
Histidine
0.182mg
0.152mg
0%
Omega-3 - DHA
0g
0.005g
N/A
Macronutrient Comparison
Macronutrient breakdown side-by-side comparison
2
9%
3%
48%
37%
3%
Protein:
8.5 g
Fats:
3.3 g
Carbs:
48.3 g
Water:
37.3 g
Other:
2.6 g
3
6%
10%
28%
53%
3%
Protein:
6.4 g
Fats:
9.7 g
Carbs:
28.3 g
Water:
52.9 g
Other:
2.7 g
Contains
more
Protein Protein
+32.8%
Contains
more
Carbs Carbs
+70.7%
Contains
more
Fats Fats
+193.9%
Contains
more
Water Water
+41.8%
Fat Type Comparison
Fat type breakdown side-by-side comparison
1
23%
48%
29%
Saturated fat:
Sat. Fat
0.626 g
Monounsaturated fat:
Mono. Fat
1.311 g
Polyunsaturated fat:
Poly. Fat
0.799 g
2
23%
27%
49%
Saturated fat:
Sat. Fat
2.122 g
Monounsaturated fat:
Mono. Fat
2.474 g
Polyunsaturated fat:
Poly. Fat
4.447 g
Contains
less
Sat. Fat Saturated fat
-70.5%
Contains
more
Mono. Fat Monounsaturated fat
+88.7%
Contains
more
Poly. Fat Polyunsaturated fat
+456.6%