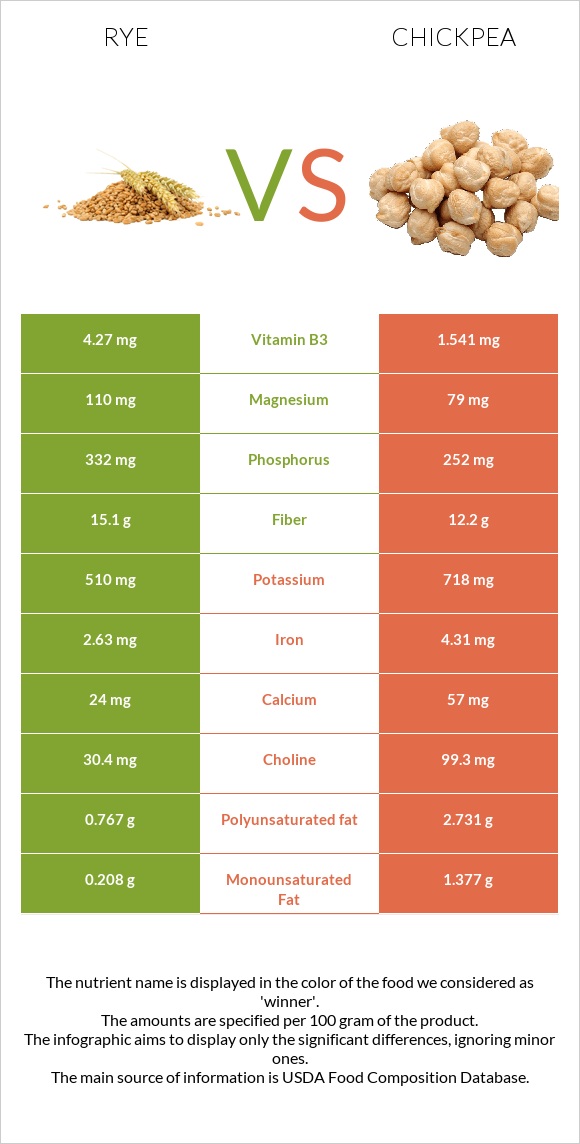
How are rye and chickpeas different? Rye is higher in manganese, fiber, phosphorus, vitamin B5, vitamin B3, selenium, vitamin B1, magnesium, and vitamin B2; however, chickpeas are richer in folate. Daily need coverage for manganese for rye is 67% higher. Rye contains 8 times more vitamin B3 than chickpeas. While rye contains 4.27mg of vitamin B3, chickpeas contain only 0.526mg. Rye grain and Chickpeas (garbanzo beans, bengal gram), mature seeds, cooked, boiled, without salt are the varieties used in this article.
Infographic
Mineral Comparison
Mineral comparison score is based on the number of minerals by which one or the other food is richer. The "coverage" charts below show how much of the daily needs can be covered by 300 grams of the food.
7
100 g
300 g
1 cup - 169g
Magnesium
Magnesium
Calcium
Calcium
Potassium
Potassium
Iron
Iron
Copper
Copper
Zinc
Zinc
Phosphorus
Phosphorus
Sodium
Sodium
Manganese
Manganese
Selenium
Selenium
79%
7.2%
45%
99%
122%
72%
142%
0.26%
336%
76%
1
100 g
300 g
1 cup - 164g
Magnesium
Magnesium
Calcium
Calcium
Potassium
Potassium
Iron
Iron
Copper
Copper
Zinc
Zinc
Phosphorus
Phosphorus
Sodium
Sodium
Manganese
Manganese
Selenium
Selenium
34%
15%
26%
108%
117%
42%
72%
0.91%
134%
20%
Vitamin Comparison
Vitamin comparison score is based on the number of vitamins by which one or the other food is richer. The "coverage" charts below show how much of the daily needs can be covered by 300 grams of the food.
7
100 g
300 g
1 cup - 169g
Vitamin C
Vit. C
Vitamin D
Vit. D
Vitamin A
Vit. A
Vitamin E
Vit. E
Vitamin B1
Vit. B1
Vitamin B2
Vit. B2
Vitamin B3
Vit. B3
Vitamin B5
Vit. B5
Vitamin B6
Vit. B6
Vitamin B12
Vit. B12
Vitamin K
Vit. K
Folate
Folate
0%
0%
0.33%
17%
79%
58%
80%
87%
68%
0%
15%
29%
2
100 g
300 g
1 cup - 164g
Vitamin C
Vit. C
Vitamin D
Vit. D
Vitamin A
Vit. A
Vitamin E
Vit. E
Vitamin B1
Vit. B1
Vitamin B2
Vit. B2
Vitamin B3
Vit. B3
Vitamin B5
Vit. B5
Vitamin B6
Vit. B6
Vitamin B12
Vit. B12
Vitamin K
Vit. K
Folate
Folate
4.3%
0%
0.33%
7%
29%
15%
9.9%
17%
32%
0%
10%
129%
All nutrients comparison - raw data values
Nutrient
DV% diff.
Manganese
2.577mg
1.03mg
67%
Folate
38µg
172µg
34%
Fiber
15.1g
7.6g
30%
Phosphorus
332mg
168mg
23%
Vitamin B3
4.27mg
0.526mg
23%
Vitamin B5
1.456mg
0.286mg
23%
Selenium
13.9µg
3.7µg
19%
Vitamin B1
0.316mg
0.116mg
17%
Carbs
75.86g
27.42g
16%
Magnesium
110mg
48mg
15%
Vitamin B2
0.251mg
0.063mg
14%
Vitamin B6
0.294mg
0.139mg
12%
Zinc
2.65mg
1.53mg
10%
Calories
338kcal
164kcal
9%
Potassium
510mg
291mg
6%
Protein
10.34g
8.86g
3%
Calcium
24mg
49mg
3%
Iron
2.63mg
2.89mg
3%
Vitamin E
0.85mg
0.35mg
3%
Polyunsaturated fat
0.767g
1.156g
3%
Copper
0.367mg
0.352mg
2%
Vitamin K
5.9µg
4µg
2%
Choline
30.4mg
42.8mg
2%
Fats
1.63g
2.59g
1%
Vitamin C
0mg
1.3mg
1%
Monounsaturated fat
0.208g
0.583g
1%
Protein per 100 calories
3.1g
5.4g
N/A
Calories per 10 g protein
327kcal
185kcal
N/A
Weight per 100 calories
30g
61g
N/A
Unsaturated / Saturated Fat ratio
4.9
6.5
N/A
Net carbs
60.76g
19.82g
N/A
Sugar
0.98g
4.8g
N/A
Sodium
2mg
7mg
0%
Vitamin A
1µg
1µg
0%
Saturated fat
0.197g
0.269g
0%
Tryptophan
0.108mg
0.085mg
0%
Threonine
0.289mg
0.329mg
0%
Isoleucine
0.208mg
0.38mg
0%
Leucine
0.563mg
0.631mg
0%
Lysine
0.286mg
0.593mg
0%
Methionine
0.153mg
0.116mg
0%
Phenylalanine
0.435mg
0.475mg
0%
Valine
0.317mg
0.372mg
0%
Histidine
0.189mg
0.244mg
0%
Fructose
0.11g
0%
Macronutrient Comparison
Macronutrient breakdown side-by-side comparison
3
10%
76%
11%
Protein:
10.34 g
Fats:
1.63 g
Carbs:
75.86 g
Water:
10.6 g
Other:
1.57 g
2
9%
3%
27%
60%
Protein:
8.86 g
Fats:
2.59 g
Carbs:
27.42 g
Water:
60.21 g
Other:
0.92 g
Contains
more
Protein Protein
+16.7%
Contains
more
Carbs Carbs
+176.7%
Contains
more
Other Other
+70.7%
Contains
more
Fats Fats
+58.9%
Contains
more
Water Water
+468%
Fat Type Comparison
Fat type breakdown side-by-side comparison
1
17%
18%
65%
Saturated fat:
Sat. Fat
0.197 g
Monounsaturated fat:
Mono. Fat
0.208 g
Polyunsaturated fat:
Poly. Fat
0.767 g
2
13%
29%
58%
Saturated fat:
Sat. Fat
0.269 g
Monounsaturated fat:
Mono. Fat
0.583 g
Polyunsaturated fat:
Poly. Fat
1.156 g
Contains
less
Sat. Fat Saturated fat
-26.8%
Contains
more
Mono. Fat Monounsaturated fat
+180.3%
Contains
more
Poly. Fat Polyunsaturated fat
+50.7%