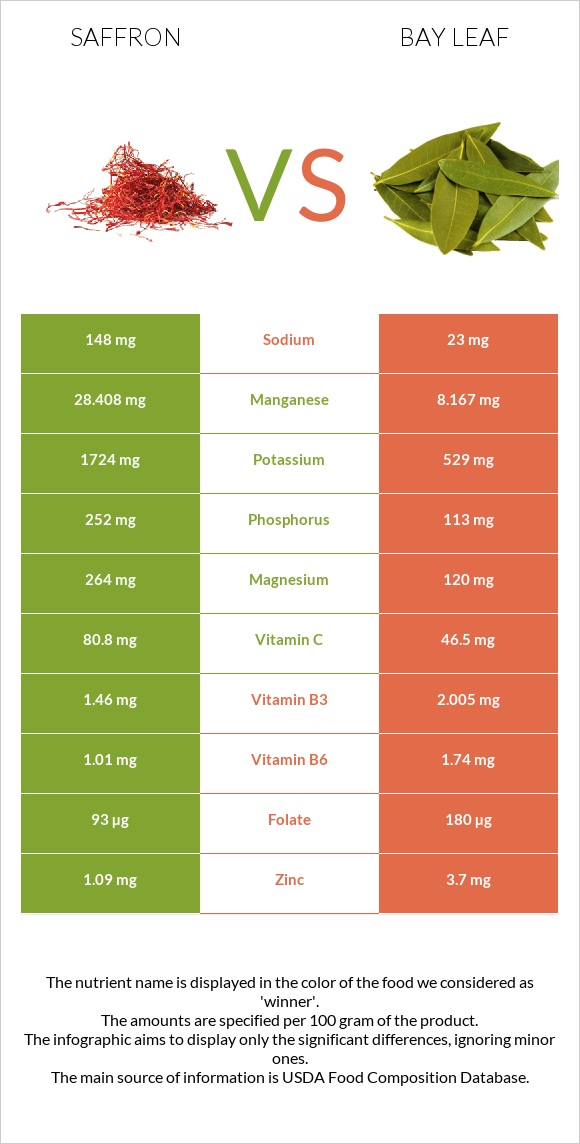
Differences between saffron and bay leaf Saffron has more manganese, vitamin C, potassium, and magnesium, while bay leaf has more iron, vitamin A, fiber, calcium, vitamin B6, and zinc. Saffron's daily need coverage for manganese is 880% higher. Bay leaf contains 3 times less potassium than saffron. Saffron contains 1724mg of potassium, while bay leaf contains 529mg. The food types used in this comparison are Spices, saffron and Spices, bay leaf .
Infographic
Mineral Comparison
Mineral comparison score is based on the number of minerals by which one or the other food is richer. The "coverage" charts below show how much of the daily needs can be covered by 300 grams of the food.
5
100 g
300 g
0.25 tsp - 0.5g 1 tbsp - 2.1g
Magnesium
Magnesium
Calcium
Calcium
Potassium
Potassium
Iron
Iron
Copper
Copper
Zinc
Zinc
Phosphorus
Phosphorus
Sodium
Sodium
Manganese
Manganese
Selenium
Selenium
189%
33%
152%
416%
109%
30%
108%
19%
3705%
31%
5
100 g
300 g
1 tsp, crumbled - 0.6g 1 tbsp, crumbled - 1.8g
Magnesium
Magnesium
Calcium
Calcium
Potassium
Potassium
Iron
Iron
Copper
Copper
Zinc
Zinc
Phosphorus
Phosphorus
Sodium
Sodium
Manganese
Manganese
Selenium
Selenium
86%
250%
47%
1613%
139%
101%
48%
3%
1065%
15%
Vitamin Comparison
Vitamin comparison score is based on the number of vitamins by which one or the other food is richer. The "coverage" charts below show how much of the daily needs can be covered by 300 grams of the food.
2
100 g
300 g
0.25 tsp - 0.5g 1 tbsp - 2.1g
Vitamin C
Vit. C
Vitamin D
Vit. D
Vitamin A
Vit. A
Vitamin E
Vit. E
Vitamin B1
Vit. B1
Vitamin B2
Vit. B2
Vitamin B3
Vit. B3
Vitamin B5
Vit. B5
Vitamin B6
Vit. B6
Vitamin B12
Vit. B12
Vitamin K
Vit. K
Folate
Folate
269%
0%
9%
0%
29%
62%
27%
0%
233%
0%
0%
70%
5
100 g
300 g
1 tsp, crumbled - 0.6g 1 tbsp, crumbled - 1.8g
Vitamin C
Vit. C
Vitamin D
Vit. D
Vitamin A
Vit. A
Vitamin E
Vit. E
Vitamin B1
Vit. B1
Vitamin B2
Vit. B2
Vitamin B3
Vit. B3
Vitamin B5
Vit. B5
Vitamin B6
Vit. B6
Vitamin B12
Vit. B12
Vitamin K
Vit. K
Folate
Folate
155%
0%
103%
0%
2.3%
97%
38%
0%
402%
0%
0%
135%
All nutrients comparison - raw data values
Nutrient
DV% diff.
Manganese
28.408mg
8.167mg
880%
Iron
11.1mg
43mg
399%
Fiber
3.9g
26.3g
90%
Calcium
111mg
834mg
72%
Vitamin B6
1.01mg
1.74mg
56%
Vitamin C
80.8mg
46.5mg
38%
Potassium
1724mg
529mg
35%
Magnesium
264mg
120mg
34%
Vitamin A
27µg
309µg
31%
Zinc
1.09mg
3.7mg
24%
Folate
93µg
180µg
22%
Phosphorus
252mg
113mg
20%
Vitamin B2
0.267mg
0.421mg
12%
Copper
0.328mg
0.416mg
10%
Vitamin B1
0.115mg
0.009mg
9%
Protein
11.43g
7.61g
8%
Sodium
148mg
23mg
5%
Selenium
5.6µg
2.8µg
5%
Fats
5.85g
8.36g
4%
Carbs
65.37g
74.97g
3%
Vitamin B3
1.46mg
2.005mg
3%
Saturated fat
1.586g
2.28g
3%
Monounsaturated fat
0.429g
1.64g
3%
Polyunsaturated fat
2.067g
2.29g
1%
Calories
310kcal
313kcal
0%
Protein per 100 calories
3.7g
2.4g
N/A
Calories per 10 g protein
271kcal
411kcal
N/A
Weight per 100 calories
32g
32g
N/A
Unsaturated / Saturated Fat ratio
1.6
1.7
N/A
Net carbs
61.47g
48.67g
N/A
Omega-3 - DPA
0.006g
0g
N/A
Macronutrient Comparison
Macronutrient breakdown side-by-side comparison
3
11%
6%
65%
12%
5%
Protein:
11.43 g
Fats:
5.85 g
Carbs:
65.37 g
Water:
11.9 g
Other:
5.45 g
2
8%
8%
75%
5%
4%
Protein:
7.61 g
Fats:
8.36 g
Carbs:
74.97 g
Water:
5.44 g
Other:
3.62 g
Contains
more
Protein Protein
+50.2%
Contains
more
Water Water
+118.8%
Contains
more
Other Other
+50.6%
Contains
more
Fats Fats
+42.9%
Contains
more
Carbs Carbs
+14.7%
Fat Type Comparison
Fat type breakdown side-by-side comparison
1
39%
11%
51%
Saturated fat:
Sat. Fat
1.586 g
Monounsaturated fat:
Mono. Fat
0.429 g
Polyunsaturated fat:
Poly. Fat
2.067 g
2
37%
26%
37%
Saturated fat:
Sat. Fat
2.28 g
Monounsaturated fat:
Mono. Fat
1.64 g
Polyunsaturated fat:
Poly. Fat
2.29 g
Contains
less
Sat. Fat Saturated fat
-30.4%
Contains
more
Mono. Fat Monounsaturated fat
+282.3%
Contains
more
Poly. Fat Polyunsaturated fat
+10.8%