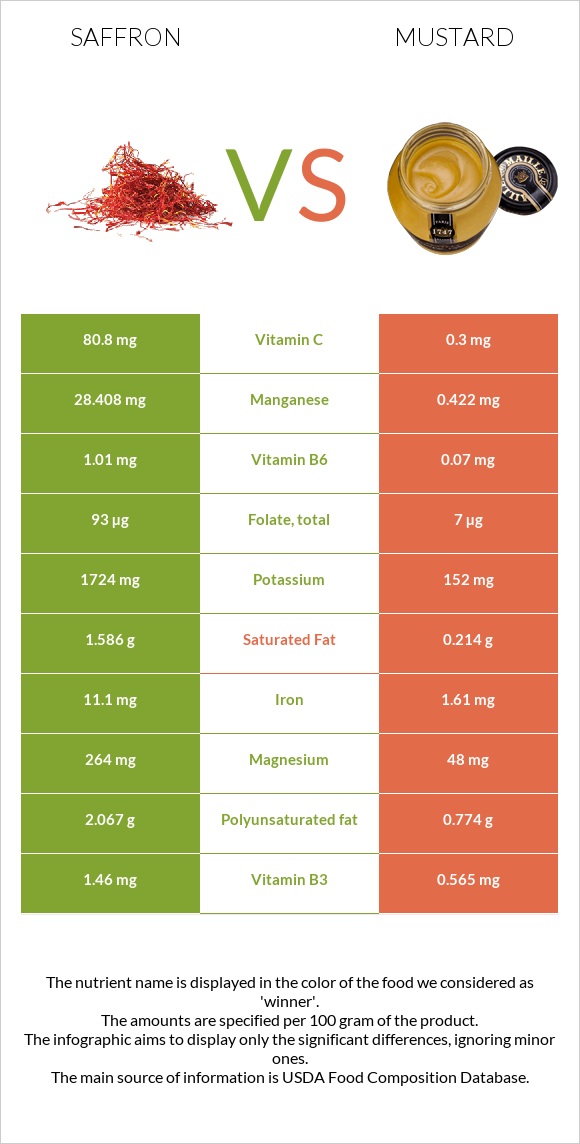
Summary of differences between saffron and mustard Saffron has more manganese, iron, vitamin C, vitamin B6, magnesium, potassium, copper, and folate; however, mustard is higher in selenium. Saffron covers your daily need for manganese, 1217% more than mustard. Saffron has 269 times more vitamin C than mustard. While saffron has 80.8mg of vitamin C, mustard has only 0.3mg. Saffron has less sodium. The glycemic index of saffron is higher. These are the specific foods used in this comparison Spices, saffron and Mustard, prepared, yellow .
Infographic
Mineral Comparison
Mineral comparison score is based on the number of minerals by which one or the other food is richer. The "coverage" charts below show how much of the daily needs can be covered by 300 grams of the food.
9
100 g
300 g
0.25 tsp - 0.5g 1 tbsp - 2.1g
Magnesium
Magnesium
Calcium
Calcium
Potassium
Potassium
Iron
Iron
Copper
Copper
Zinc
Zinc
Phosphorus
Phosphorus
Sodium
Sodium
Manganese
Manganese
Selenium
Selenium
189%
33%
152%
416%
109%
30%
108%
19%
3705%
31%
1
100 g
300 g
1 tsp or 1 packet - 5g 1 cup - 249g
Magnesium
Magnesium
Calcium
Calcium
Potassium
Potassium
Iron
Iron
Copper
Copper
Zinc
Zinc
Phosphorus
Phosphorus
Sodium
Sodium
Manganese
Manganese
Selenium
Selenium
34%
19%
13%
60%
25%
17%
46%
144%
55%
183%
Vitamin Comparison
Vitamin comparison score is based on the number of vitamins by which one or the other food is richer. The "coverage" charts below show how much of the daily needs can be covered by 300 grams of the food.
6
100 g
300 g
0.25 tsp - 0.5g 1 tbsp - 2.1g
Vitamin C
Vit. C
Vitamin D
Vit. D
Vitamin A
Vit. A
Vitamin E
Vit. E
Vitamin B1
Vit. B1
Vitamin B2
Vit. B2
Vitamin B3
Vit. B3
Vitamin B5
Vit. B5
Vitamin B6
Vit. B6
Vitamin B12
Vit. B12
Vitamin K
Vit. K
Folate
Folate
269%
0%
9%
0%
29%
62%
27%
0%
233%
0%
0%
70%
4
100 g
300 g
1 tsp or 1 packet - 5g 1 cup - 249g
Vitamin C
Vit. C
Vitamin D
Vit. D
Vitamin A
Vit. A
Vitamin E
Vit. E
Vitamin B1
Vit. B1
Vitamin B2
Vit. B2
Vitamin B3
Vit. B3
Vitamin B5
Vit. B5
Vitamin B6
Vit. B6
Vitamin B12
Vit. B12
Vitamin K
Vit. K
Folate
Folate
1%
0%
1.7%
7.2%
44%
16%
11%
15%
16%
0%
3.5%
5.3%
All nutrients comparison - raw data values
Nutrient
DV% diff.
Manganese
28.408mg
0.422mg
1217%
Iron
11.1mg
1.61mg
119%
Vitamin C
80.8mg
0.3mg
89%
Vitamin B6
1.01mg
0.07mg
72%
Magnesium
264mg
48mg
51%
Selenium
5.6µg
33.5µg
51%
Potassium
1724mg
152mg
46%
Sodium
148mg
1104mg
42%
Copper
0.328mg
0.074mg
28%
Folate
93µg
7µg
22%
Phosphorus
252mg
108mg
21%
Carbs
65.37g
5.83g
20%
Protein
11.43g
3.74g
15%
Vitamin B2
0.267mg
0.07mg
15%
Calories
310kcal
60kcal
13%
Polyunsaturated fat
2.067g
0.774g
9%
Vitamin B3
1.46mg
0.565mg
6%
Saturated fat
1.586g
0.214g
6%
Calcium
111mg
63mg
5%
Vitamin B1
0.115mg
0.177mg
5%
Vitamin B5
0.254mg
5%
Fats
5.85g
3.34g
4%
Zinc
1.09mg
0.64mg
4%
Choline
22.4mg
4%
Monounsaturated fat
0.429g
2.182g
4%
Vitamin A
27µg
5µg
2%
Vitamin E
0.36mg
2%
Vitamin K
1.4µg
1%
Protein per 100 calories
3.7g
6.2g
N/A
Calories per 10 g protein
271kcal
160kcal
N/A
Weight per 100 calories
32g
167g
N/A
Unsaturated / Saturated Fat ratio
1.6
14
N/A
Net carbs
61.47g
1.83g
N/A
Sugar
0.92g
N/A
Fiber
3.9g
4g
0%
Starch
0.64g
0%
Trans fat
0g
0.009g
N/A
Tryptophan
0.009mg
0%
Threonine
0.167mg
0%
Isoleucine
0.146mg
0%
Leucine
0.292mg
0%
Lysine
0.264mg
0%
Methionine
0.076mg
0%
Phenylalanine
0.161mg
0%
Valine
0.189mg
0%
Histidine
0.119mg
0%
Fructose
0.23g
0%
Omega-3 - ALA
0.373g
N/A
Omega-3 - DPA
0.006g
0g
N/A
Omega-3 - Eicosatrienoic acid
0.018g
N/A
Omega-6 - Eicosadienoic acid
0.01g
N/A
Omega-6 - Linoleic acid
0.358g
N/A
Macronutrient Comparison
Macronutrient breakdown side-by-side comparison
4
11%
6%
65%
12%
5%
Protein:
11.43 g
Fats:
5.85 g
Carbs:
65.37 g
Water:
11.9 g
Other:
5.45 g
1
4%
3%
6%
84%
3%
Protein:
3.74 g
Fats:
3.34 g
Carbs:
5.83 g
Water:
83.72 g
Other:
3.37 g
Contains
more
Protein Protein
+205.6%
Contains
more
Fats Fats
+75.1%
Contains
more
Carbs Carbs
+1021.3%
Contains
more
Other Other
+61.7%
Contains
more
Water Water
+603.5%
Fat Type Comparison
Fat type breakdown side-by-side comparison
1
39%
11%
51%
Saturated fat:
Sat. Fat
1.586 g
Monounsaturated fat:
Mono. Fat
0.429 g
Polyunsaturated fat:
Poly. Fat
2.067 g
2
7%
69%
24%
Saturated fat:
Sat. Fat
0.214 g
Monounsaturated fat:
Mono. Fat
2.182 g
Polyunsaturated fat:
Poly. Fat
0.774 g
Contains
more
Poly. Fat Polyunsaturated fat
+167.1%
Contains
less
Sat. Fat Saturated fat
-86.5%
Contains
more
Mono. Fat Monounsaturated fat
+408.6%