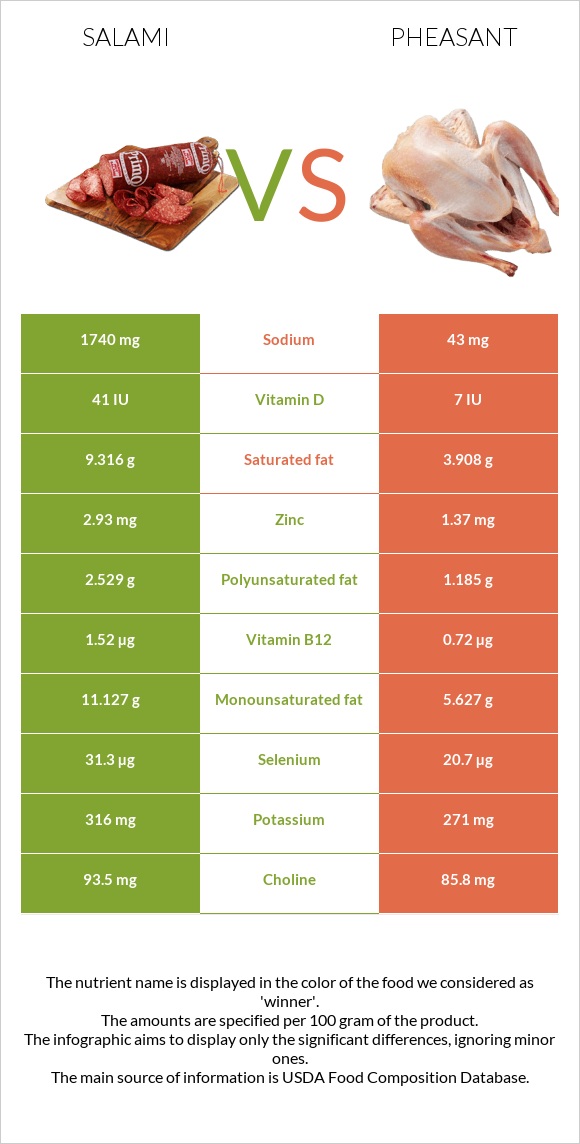
Important differences between salami and pheasant Salami has more vitamin B12, copper, vitamin B1, selenium, zinc, and vitamin B2; however, pheasant has more vitamin B6 and vitamin B3. Salami's daily need coverage for sodium is 74% more. Salami has 5 times more vitamin B1 than pheasant. Salami has 0.367mg of vitamin B1, while pheasant has 0.07mg. Pheasant is lower in sodium. The food varieties used in the comparison are Salami, cooked, beef, and pork and Pheasant, cooked, total edible .
Infographic
Mineral Comparison
Mineral comparison score is based on the number of minerals by which one or the other food is richer. The "coverage" charts below show how much of the daily needs can be covered by 300 grams of the food.
5
100 g
300 g
1 slice round - 12.3g
Magnesium
Magnesium
Calcium
Calcium
Potassium
Potassium
Iron
Iron
Copper
Copper
Zinc
Zinc
Phosphorus
Phosphorus
Sodium
Sodium
Manganese
Manganese
Selenium
Selenium
14%
4.5%
28%
59%
119%
80%
82%
227%
128%
171%
3
100 g
300 g
1 cup, chopped or diced - 140g
Magnesium
Magnesium
Calcium
Calcium
Potassium
Potassium
Iron
Iron
Copper
Copper
Zinc
Zinc
Phosphorus
Phosphorus
Sodium
Sodium
Manganese
Manganese
Selenium
Selenium
16%
4.8%
24%
54%
28%
37%
104%
5.6%
0%
113%
Vitamin Comparison
Vitamin comparison score is based on the number of vitamins by which one or the other food is richer. The "coverage" charts below show how much of the daily needs can be covered by 300 grams of the food.
5
100 g
300 g
1 slice round - 12.3g
Vitamin C
Vit. C
Vitamin D
Vit. D
Vitamin A
Vit. A
Vitamin E
Vit. E
Vitamin B1
Vit. B1
Vitamin B2
Vit. B2
Vitamin B3
Vit. B3
Vitamin B5
Vit. B5
Vitamin B6
Vit. B6
Vitamin B12
Vit. B12
Vitamin K
Vit. K
Folate
Folate
0%
15%
0%
4.4%
92%
82%
113%
72%
106%
190%
8%
2.3%
7
100 g
300 g
1 cup, chopped or diced - 140g
Vitamin C
Vit. C
Vitamin D
Vit. D
Vitamin A
Vit. A
Vitamin E
Vit. E
Vitamin B1
Vit. B1
Vitamin B2
Vit. B2
Vitamin B3
Vit. B3
Vitamin B5
Vit. B5
Vitamin B6
Vit. B6
Vitamin B12
Vit. B12
Vitamin K
Vit. K
Folate
Folate
7.7%
3%
19%
5.4%
18%
42%
141%
0%
173%
90%
12%
3.8%
All nutrients comparison - raw data values
Nutrient
DV% diff.
Sodium
1740mg
43mg
74%
Manganese
0.978mg
43%
Vitamin B12
1.52µg
0.72µg
33%
Copper
0.357mg
0.084mg
30%
Vitamin B1
0.367mg
0.07mg
25%
Saturated fat
9.316g
3.908g
25%
Vitamin B5
1.201mg
24%
Vitamin B6
0.459mg
0.75mg
22%
Protein
21.85g
32.4g
21%
Fats
25.9g
12.1g
21%
Selenium
31.3µg
20.7µg
19%
Zinc
2.93mg
1.37mg
14%
Vitamin B2
0.357mg
0.18mg
14%
Monounsaturated fat
11.127g
5.627g
14%
Vitamin B3
6.053mg
7.53mg
9%
Polyunsaturated fat
2.529g
1.185g
9%
Phosphorus
191mg
242mg
7%
Vitamin A
0µg
57µg
6%
Calories
336kcal
239kcal
5%
Vitamin D*
41 IU
7 IU
4%
Vitamin D
1µg
0.2µg
4%
Vitamin C
0mg
2.3mg
3%
Iron
1.56mg
1.43mg
2%
Carbs
2.4g
0g
1%
Magnesium
19mg
22mg
1%
Potassium
316mg
271mg
1%
Vitamin K
3.2µg
4.9µg
1%
Folate
3µg
5µg
1%
Choline
93.5mg
85.8mg
1%
Protein per 100 calories
6.5g
14g
N/A
Calories per 10 g protein
154kcal
74kcal
N/A
Weight per 100 calories
30g
42g
N/A
Unsaturated / Saturated Fat ratio
1.5
1.7
N/A
Net carbs
2.4g
0g
N/A
Cholesterol
89mg
89mg
0%
Calcium
15mg
16mg
0%
Sugar
0.96g
0g
N/A
Vitamin E
0.22mg
0.27mg
0%
Trans fat
0.586g
N/A
Tryptophan
0.114mg
0%
Threonine
0.521mg
0%
Isoleucine
0.675mg
0%
Leucine
0.929mg
0%
Lysine
1.107mg
0%
Methionine
0.301mg
0%
Phenylalanine
0.481mg
0%
Valine
0.668mg
0%
Histidine
0.359mg
0%
Omega-3 - ALA
0.126g
N/A
Omega-6 - Eicosadienoic acid
0.084g
N/A
Omega-6 - Linoleic acid
2.104g
N/A
Macronutrient Comparison
Macronutrient breakdown side-by-side comparison
3
22%
26%
2%
45%
5%
Protein:
21.85 g
Fats:
25.9 g
Carbs:
2.4 g
Water:
45.19 g
Other:
4.66 g
2
32%
12%
54%
Protein:
32.4 g
Fats:
12.1 g
Carbs:
0 g
Water:
54.2 g
Other:
1.3 g
Contains
more
Fats Fats
+114%
Contains
more
Carbs Carbs
+∞%
Contains
more
Other Other
+258.5%
Contains
more
Protein Protein
+48.3%
Contains
more
Water Water
+19.9%
Fat Type Comparison
Fat type breakdown side-by-side comparison
2
41%
48%
11%
Saturated fat:
Sat. Fat
9.316 g
Monounsaturated fat:
Mono. Fat
11.127 g
Polyunsaturated fat:
Poly. Fat
2.529 g
1
36%
52%
11%
Saturated fat:
Sat. Fat
3.908 g
Monounsaturated fat:
Mono. Fat
5.627 g
Polyunsaturated fat:
Poly. Fat
1.185 g
Contains
more
Mono. Fat Monounsaturated fat
+97.7%
Contains
more
Poly. Fat Polyunsaturated fat
+113.4%
Contains
less
Sat. Fat Saturated fat
-58.1%