Scallops vs. Shrimp — Health Impact and Nutrition Comparison


Summary
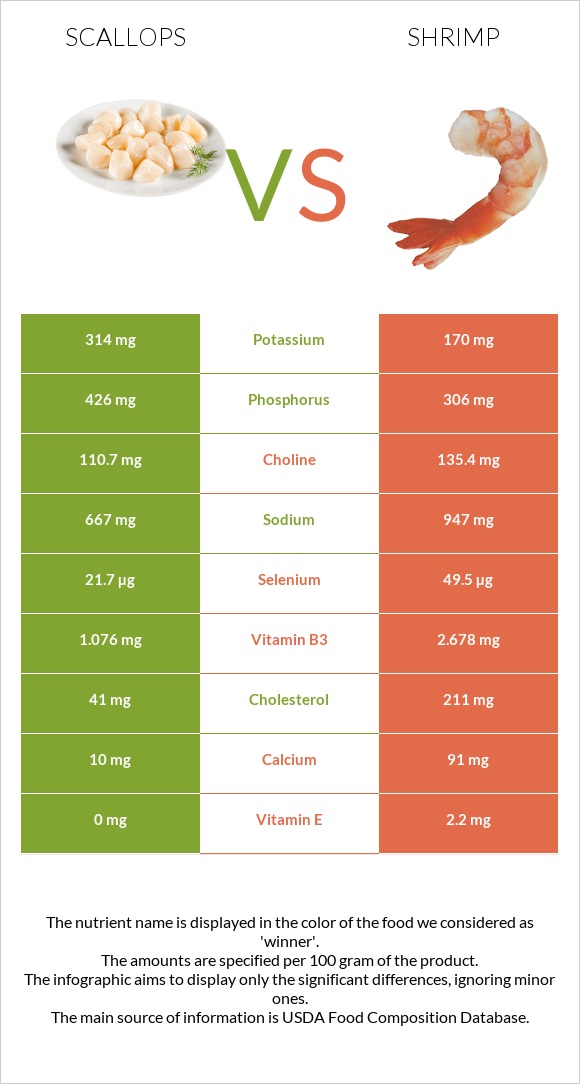
Shrimp is higher in selenium, copper, vitamin E, vitamin B3, vitamin B6, and vitamin A. On the other hand, scallops are more prosperous in vitamin B12 and phosphorus. Shrimps have a 57% higher daily need for cholesterol coverage than scallops. However, scallops contain less cholesterol.
Introduction
Shrimp and scallops are popular types of seafood. This article will discuss their differences and similarities, mainly focusing on nutrition and health impact.
Nutrition
Here is the nutritional information for mixed species of shrimp cooked with moist heat and bay and sea scallops steamed. The average serving size for shrimp and scallops is 3 ounces or 85 grams.
Macronutrients and Calories
Shrimp and scallops have almost the same density of nutrients, consisting of 72% water and 28% nutrients, while scallops comprise 70% water and 30% nutrients.
Macronutrient Comparison
Contains
more
CarbsCarbs
+255.9%
Contains
more
OtherOther
+21.3%
Contains
more
ProteinProtein
+10.9%
Contains
more
FatsFats
+102.4%
Calories
Shrimp and scallops are both medium-calorie foods; however, shrimp provides more calories with 119 kcal per 100g serving. The same serving of scallops contains 111 calories.
Protein
Like many shellfish, shrimp and scallops are excellent sources of protein. Shrimp is richer in protein by about 2g per 100g serving. A 100-gram serving of shrimp covers 48–50% of the daily protein value by containing 22.7g. The same 100-gram serving of scallops contains 20.5 grams of protein, covering 49% of the daily protein value.
The protein found in these shellfish is of high quality, as it contains high levels of all essential amino acids. Naturally, shrimp are more prosperous in all these amino acids.
Fats
While both foods are low-fat, shrimp contains over two times more fat. Shrimp provide less than 2g of fat per 100g serving. Shrimp also have a fat profile that is preferable to scallops, which contain predominantly polyunsaturated fats, such as omega-3 fatty acids.
Fat Type Comparison
Contains
less
Sat. FatSaturated fat
-58.2%
Contains
more
Mono. FatMonounsaturated fat
+340.2%
Contains
more
Poly. FatPolyunsaturated fat
+165.8%
Carbohydrates
Shrimp and scallops are low-carbohydrate foods. However, shrimp are lower in carbs than scallops. For every 100 grams, shrimp contain 1.52 grams, and scallops contain 5.41 grams. The carbohydrate content of both shrimp and scallops consists entirely of net carbs, as they don’t provide dietary fiber.
Cholesterol
Scallops are lower in cholesterol, containing 41mg per 100g serving, while shrimp have 211mg of cholesterol in the same serving.
Minerals
Shrimp is relatively richer in minerals, nine times higher in calcium, eight times higher in copper, two times richer in selenium, and 1.5 times higher in manganese and sodium. Scallops, however, are a better source of potassium and phosphorus. Both contain almost equal amounts of iron, magnesium, and zinc.
Mineral Comparison
Contains
more
PotassiumPotassium
+84.7%
Contains
more
IronIron
+81.3%
Contains
more
PhosphorusPhosphorus
+39.2%
Contains
less
SodiumSodium
-29.6%
Contains
more
CalciumCalcium
+810%
Contains
more
CopperCopper
+681.8%
Contains
more
ManganeseManganese
+69%
Contains
more
SeleniumSelenium
+128.1%
Vitamins
Shrimp is the ultimate winner in the vitamin category. Shrimp is over 60 times richer in vitamin A. Shrimp is also a better source of vitamin E, vitamin D, vitamin K, vitamin B3, vitamin B5, vitamin B6, vitamin B1, and folate, or vitamin B9.
Scallops have higher vitamin B12 levels than shrimp. Both contain equal amounts of vitamin B2.
Vitamin Comparison
Contains
more
Vitamin B12Vitamin B12
+29.5%
Contains
more
Vitamin AVitamin A
+4400%
Contains
more
Vitamin EVitamin E
+∞%
Contains
more
Vitamin DVitamin D
+∞%
Contains
more
Vitamin B1Vitamin B1
+166.7%
Contains
more
Vitamin B3Vitamin B3
+148.9%
Contains
more
Vitamin B5Vitamin B5
+41.8%
Contains
more
Vitamin B6Vitamin B6
+116.1%
Contains
more
Vitamin KVitamin K
+∞%
Contains
more
FolateFolate
+20%
Acidity
Shrimp have a PRAL value of 16.8 (acidic), while scallops have a slightly higher acidity with a PRAL value of 18.1 (acidic).
Weight Loss and Diets
Shrimp and scallops can benefit weight loss due to their low-calorie and high-protein nature. Both are lean protein sources that can help you feel full while consuming fewer calories (1). Its high thermic effect means the body expends more energy to digest and process the protein (2). Additionally, shrimp provide essential nutrients like iodine, selenium, and vitamin B12. It is low in fat and carbohydrates, making it a healthy option, especially when prepared through grilling, baking, or steaming.
Health Benefits
Protein is essential for the body's repair and growth, and scallops and shrimp are good sources. As well as being a good source of iron, essential for transporting oxygen to cells, they also contain zinc, copper, and selenium, all essential nutrients.
Cardiovascular Health
You can improve your heart health simply by adding shrimp and scallops to your diet.
Studies show that these seafood options have been linked to reducing arterial blood pressure, thanks to their ability to decrease renin-angiotensin-aldosterone system (RAAS) activity (3,4).
Astaxanthin in shrimp is a potent nutrient that may have a role in preventing atherosclerosis. Its antioxidant ability is just one of the many benefits it offers. Studies have established that astaxanthin can improve inflammation, lipid metabolism, and glucose metabolism, which are crucial in preventing this severe condition (5).
Both shrimp and scallops are high in polyunsaturated fatty acids, which may lower the cardiovascular risk (6,7).
It is important to note that shrimp contains dietary cholesterol, which has been found to increase LDL levels. Although the effect is modest, it should be noted that approximately 15-25% of individuals are hyper-responders who experience more significant increases. Additionally, consuming dietary cholesterol can reduce hepatic LDL receptor activity, leading to a decrease in clearance and an increase in the production of LDL (8).
Brain Health
Scallops and shrimp contribute to brain health by providing essential nutrients that support proper development and function. A 3-ounce serving of scallops contains over 100% of the daily value for vitamin B12, over 16% for zinc, and over 200 mg of omega-3 fatty acids. Vitamin B12 is crucial for nervous system development, and zinc plays a role in brain health, with deficiency linked to cognitive decline (9,10,11).Omega-3 fatty acids in both scallops and shrimp are essential for brain health and development, potentially reducing the risk of mental conditions (12). Additionally, astaxanthin in shrimp may have anti-inflammatory properties that could prevent damage to brain cells and contribute to overall brain health (13).
Downsides and Risks
Food allergies to shellfish and mollusks are common. Shellfish allergies can cause skin rashes, hives, swelling, difficulty breathing, nausea, vomiting, and anaphylaxis.
Many people have cross-reactions with other shellfish and shellfish that are allergic to only one type. In other words, if you are allergic to shrimp, you might also be allergic to scallops and the other way around. An allergic reaction to shellfish is typically caused by tropomyosin, a protein your immune system produces (14,15). Importantly, shrimp may be farm-raised and treated with antibiotics, posing concerns about antibiotic resistance and potential contamination in the U.S. food supply (16,17). The environment in which scallops live can cause them to accumulate heavy metals like mercury, cadmium, arsenic, and lead. Chronic exposure to these heavy metals can lead to various health issues, including cancer, organ damage, and developmental problems (18,19). According to limited research on scallop heavy metal concentrations, scallops may have varying levels of cadmium depending on their location. Despite these concerns, the health benefits of consuming scallops in moderation outweigh the potential risks of heavy metal exposure.
Classification and Appearance
Shrimp and scallops, while both classified as shellfish, belong to different categories within the aquatic animal kingdom. Shrimp are crustaceans, related to lobsters, crawfish, and crabs, whereas scallops are mollusks, similar to clams, oysters, and mussels. Despite being shellfish, they are not categorized as fish or vertebrates with gills and fins. Shrimps feed on worms, plankton, and other shellfish, while scallops consume small plants and animals.
Shrimp have a segmented exoskeleton and jointed legs and reside in various environments, from coastal areas to deep ocean waters. They often hide near the ocean floor in crevices or caves, and their exoskeleton allows for flexible movement. On the other hand, scallops can be found in saltwater and freshwater environments, usually in deeper waters with sandy or muddy bottoms. They have flatter, more circular shells with scalloped edges, a defining feature. While shrimp have a protective exoskeleton covering their bodies, scallops have shells with hinged edges.
Taste and Use
Regarding taste, shrimp is known for its sweet and delicate flavor with a slightly crisp texture when cooked. It absorbs seasonings well and can be enjoyed in various cooking methods, such as grilling, broiling, or baking. Shrimp's versatility suits various dishes, from stir-fries to salads. On the other hand, scallops offer a distinct flavor characterized by a sweet, buttery taste and a tender, melt-in-your-mouth texture. They are often seared in a hot pan with butter or oil, grilled, broiled, or baked. Scallops pair well with seasonings like garlic, tarragon, ginger and fresh herbs like parsley, basil, and dill.
Sources
- https://pubmed.ncbi.nlm.nih.gov/25926512/
- https://www.ncbi.nlm.nih.gov/pmc/articles/PMC7539343/
- https://pubmed.ncbi.nlm.nih.gov/31467699/
- https://www.ncbi.nlm.nih.gov/pmc/articles/PMC10217082/
- https://www.ncbi.nlm.nih.gov/pmc/articles/PMC4771988/
- https://pubmed.ncbi.nlm.nih.gov/34371930/
- https://pubmed.ncbi.nlm.nih.gov/22051327/
- https://pubmed.ncbi.nlm.nih.gov/33945244/
- https://www.ncbi.nlm.nih.gov/pmc/articles/PMC6930825/
- https://www.ncbi.nlm.nih.gov/pmc/articles/PMC5751109/
- https://pubmed.ncbi.nlm.nih.gov/34956975/
- https://www.ncbi.nlm.nih.gov/pmc/articles/PMC4369545/
- https://www.ncbi.nlm.nih.gov/pmc/articles/PMC5352583/
- https://pubmed.ncbi.nlm.nih.gov/28027402/
- https://pubmed.ncbi.nlm.nih.gov/28027402/
- https://www.ncbi.nlm.nih.gov/pmc/articles/PMC8495020/
- https://www.nature.com/articles/
- https://www.ncbi.nlm.nih.gov/pmc/articles/PMC7700650/
- https://www.ncbi.nlm.nih.gov/pmc/articles/PMC8078867/

Infographic
All nutrients comparison - raw data values
| Nutrient | |
|
DV% diff. |
| Cholesterol | 41mg | 211mg | 57% |
| Selenium | 21.7µg | 49.5µg | 51% |
| Copper | 0.033mg | 0.258mg | 25% |
| Vitamin B12 | 2.15µg | 1.66µg | 20% |
| Phosphorus | 426mg | 306mg | 17% |
| Vitamin E | 0mg | 2.2mg | 15% |
| Sodium | 667mg | 947mg | 12% |
| Vitamin A | 2µg | 90µg | 10% |
| Vitamin B3 | 1.076mg | 2.678mg | 10% |
| Vitamin B6 | 0.112mg | 0.242mg | 10% |
| Calcium | 10mg | 91mg | 8% |
| Protein | 20.54g | 22.78g | 4% |
| Potassium | 314mg | 170mg | 4% |
| Choline | 110.7mg | 135.4mg | 4% |
| Iron | 0.58mg | 0.32mg | 3% |
| Vitamin B5 | 0.366mg | 0.519mg | 3% |
| Starch | 3.69g | 0g | 2% |
| Vitamin B1 | 0.012mg | 0.032mg | 2% |
| Polyunsaturated fat | 0.222g | 0.59g | 2% |
| Fats | 0.84g | 1.7g | 1% |
| Carbs | 5.41g | 1.52g | 1% |
| Zinc | 1.55mg | 1.63mg | 1% |
| Vitamin D | 0µg | 0.1µg | 1% |
| Manganese | 0.029mg | 0.049mg | 1% |
| Folate | 20µg | 24µg | 1% |
| Saturated fat | 0.218g | 0.521g | 1% |
| Monounsaturated fat | 0.082g | 0.361g | 1% |
| Calories | 111kcal | 119kcal | 0% |
| Net carbs | 5.41g | 1.52g | N/A |
| Vitamin D | 2 IU | 4 IU | 0% |
| Magnesium | 37mg | 37mg | 0% |
| Vitamin B2 | 0.024mg | 0.024mg | 0% |
| Vitamin K | 0µg | 0.4µg | 0% |
| Trans fat | 0.009g | 0.035g | N/A |
| Tryptophan | 0.173mg | 0.26mg | 0% |
| Threonine | 0.629mg | 0.904mg | 0% |
| Isoleucine | 0.692mg | 1.05mg | 0% |
| Leucine | 1.226mg | 1.95mg | 0% |
| Lysine | 1.258mg | 2.172mg | 0% |
| Methionine | 0.487mg | 0.665mg | 0% |
| Phenylalanine | 0.597mg | 0.992mg | 0% |
| Valine | 0.645mg | 1.067mg | 0% |
| Histidine | 0.314mg | 0.501mg | 0% |
| Omega-3 - EPA | 0.072g | 0.135g | N/A |
| Omega-3 - DHA | 0.104g | 0.141g | N/A |
| Omega-3 - DPA | 0.005g | 0.012g | N/A |
| Omega-6 - Eicosadienoic acid | 0.002g | 0.012g | N/A |
People also compare


References
All the values for which the sources are not specified explicitly are taken from FDA’s Food Central. The exact link to the food presented on this page can be found below.
- Scallops - https://fdc.nal.usda.gov/fdc-app.html#/food-details/167742/nutrients
- Shrimp - https://fdc.nal.usda.gov/fdc-app.html#/food-details/171971/nutrients
All the Daily Values are presented for males aged 31-50, for 2000-calorie diets.