Sea cucumber vs. Peach — In-Depth Nutrition Comparison
Compare
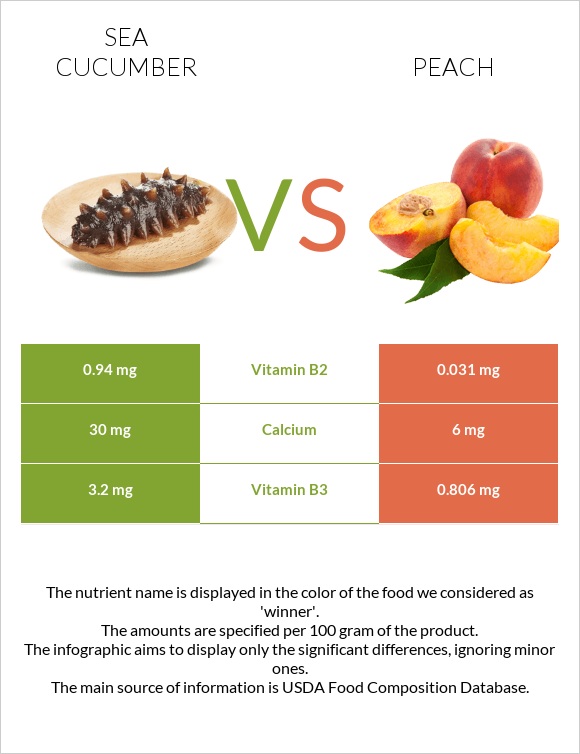
What are the main differences between sea cucumber and peach?
- Peach has less vitamin B2 and vitamin B3 than sea cucumber.
- Sea cucumber's daily need coverage for vitamin B2 is 70% higher.
- Sea cucumber has 5 times more calcium than peach. Sea cucumber has 30mg of calcium, while peach has 6mg.
- Sea cucumber has a lower glycemic index than peach.
We used Sea cucumber, yane (Alaska Native) and Peaches, yellow, raw types in this comparison.
Infographic
Infographic link
Mineral Comparison
Mineral comparison score is based on the number of minerals by which one or the other food is richer. The "coverage" charts below show how much of the daily needs can be covered by 300 grams of the food.
| Contains more CalciumCalcium | +400% |
| Contains more IronIron | +140% |
Vitamin Comparison
Vitamin comparison score is based on the number of vitamins by which one or the other food is richer. The "coverage" charts below show how much of the daily needs can be covered by 300 grams of the food.
| Contains more Vitamin B1Vitamin B1 | +108.3% |
| Contains more Vitamin B2Vitamin B2 | +2932.3% |
| Contains more Vitamin B3Vitamin B3 | +297% |
All nutrients comparison - raw data values
| Nutrient |  |
 |
DV% diff. |
| Vitamin B2 | 0.94mg | 0.031mg | 70% |
| Protein | 13g | 0.91g | 24% |
| Vitamin B3 | 3.2mg | 0.806mg | 15% |
| Copper | 0.068mg | 8% | |
| Vitamin C | 6.6mg | 7% | |
| Potassium | 190mg | 6% | |
| Fiber | 1.5g | 6% | |
| Vitamin E | 0.73mg | 5% | |
| Iron | 0.6mg | 0.25mg | 4% |
| Carbs | 0g | 9.54g | 3% |
| Vitamin B5 | 0.153mg | 3% | |
| Phosphorus | 20mg | 3% | |
| Manganese | 0.061mg | 3% | |
| Vitamin K | 2.6µg | 2% | |
| Vitamin B6 | 0.025mg | 2% | |
| Vitamin B1 | 0.05mg | 0.024mg | 2% |
| Fructose | 1.53g | 2% | |
| Vitamin A | 16µg | 2% | |
| Zinc | 0.17mg | 2% | |
| Calcium | 30mg | 6mg | 2% |
| Magnesium | 9mg | 2% | |
| Folate | 4µg | 1% | |
| Polyunsaturated fat | 0.086g | 1% | |
| Choline | 6.1mg | 1% | |
| Calories | 56kcal | 39kcal | 1% |
| Fats | 0.4g | 0.25g | 0% |
| Net carbs | 0g | 8.04g | N/A |
| Sugar | 8.39g | N/A | |
| Selenium | 0.1µg | 0% | |
| Saturated fat | 0.019g | 0% | |
| Monounsaturated fat | 0.067g | 0% | |
| Tryptophan | 0.01mg | 0% | |
| Threonine | 0.016mg | 0% | |
| Isoleucine | 0.017mg | 0% | |
| Leucine | 0.027mg | 0% | |
| Lysine | 0.03mg | 0% | |
| Methionine | 0.01mg | 0% | |
| Phenylalanine | 0.019mg | 0% | |
| Valine | 0.022mg | 0% | |
| Histidine | 0.013mg | 0% |
Macronutrient Comparison
Macronutrient breakdown side-by-side comparison
Protein:
13 g
Fats:
0.4 g
Carbs:
0 g
Water:
80.7 g
Other:
5.9 g
Protein:
0.91 g
Fats:
0.25 g
Carbs:
9.54 g
Water:
88.87 g
Other:
0.43 g
| Contains more ProteinProtein | +1328.6% |
| Contains more FatsFats | +60% |
| Contains more OtherOther | +1272.1% |
| Contains more CarbsCarbs | +∞% |
| Contains more WaterWater | +10.1% |


