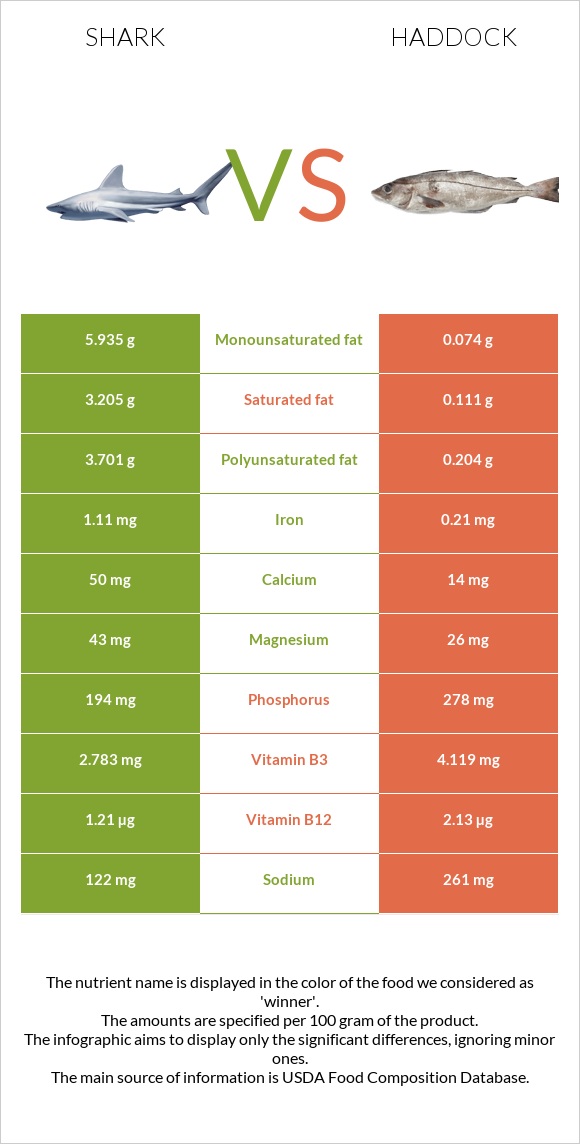
Significant differences between shark and haddock Shark has more iron and monounsaturated fat; however, haddock is richer in vitamin B12, phosphorus, vitamin B3, and potassium. Haddock covers your daily vitamin B12 needs 38% more than shark. Haddock has 80 times less monounsaturated fat than shark. Shark has 5.935g of monounsaturated fat, while haddock has 0.074g. Haddock contains less saturated fat. Specific food types used in this comparison are Fish, shark, mixed species, cooked, batter-dipped and fried and Fish, haddock, cooked, dry heat .
Infographic
Mineral Comparison
Mineral comparison score is based on the number of minerals by which one or the other food is richer. The "coverage" charts below show how much of the daily needs can be covered by 300 grams of the food.
7
100 g
300 g
3 oz - 85g
Magnesium
Magnesium
Calcium
Calcium
Potassium
Potassium
Iron
Iron
Copper
Copper
Zinc
Zinc
Phosphorus
Phosphorus
Sodium
Sodium
Manganese
Manganese
Selenium
Selenium
31%
15%
14%
42%
14%
13%
83%
16%
6.5%
185%
2
100 g
300 g
3 oz - 85g 1 fillet - 150g
Magnesium
Magnesium
Calcium
Calcium
Potassium
Potassium
Iron
Iron
Copper
Copper
Zinc
Zinc
Phosphorus
Phosphorus
Sodium
Sodium
Manganese
Manganese
Selenium
Selenium
19%
4.2%
31%
7.9%
8.7%
11%
119%
34%
1.7%
173%
Vitamin Comparison
Vitamin comparison score is based on the number of vitamins by which one or the other food is richer. The "coverage" charts below show how much of the daily needs can be covered by 300 grams of the food.
5
100 g
300 g
3 oz - 85g
Vitamin C
Vit. C
Vitamin D
Vit. D
Vitamin A
Vit. A
Vitamin E
Vit. E
Vitamin B1
Vit. B1
Vitamin B2
Vit. B2
Vitamin B3
Vit. B3
Vitamin B5
Vit. B5
Vitamin B6
Vit. B6
Vitamin B12
Vit. B12
Vitamin K
Vit. K
Folate
Folate
0%
0%
18%
0%
18%
22%
52%
37%
69%
151%
0%
11%
5
100 g
300 g
3 oz - 85g 1 fillet - 150g
Vitamin C
Vit. C
Vitamin D
Vit. D
Vitamin A
Vit. A
Vitamin E
Vit. E
Vitamin B1
Vit. B1
Vitamin B2
Vit. B2
Vitamin B3
Vit. B3
Vitamin B5
Vit. B5
Vitamin B6
Vit. B6
Vitamin B12
Vit. B12
Vitamin K
Vit. K
Folate
Folate
0%
9%
7%
11%
5.8%
16%
77%
30%
75%
266%
0.25%
9.8%
All nutrients comparison - raw data values
Nutrient
DV% diff.
Vitamin B12
1.21µg
2.13µg
38%
Polyunsaturated fat
3.701g
0.204g
23%
Fats
13.82g
0.55g
20%
Monounsaturated fat
5.935g
0.074g
15%
Choline
79.6mg
14%
Saturated fat
3.205g
0.111g
14%
Phosphorus
194mg
278mg
12%
Iron
1.11mg
0.21mg
11%
Vitamin B3
2.783mg
4.119mg
8%
Calories
228kcal
90kcal
7%
Potassium
155mg
351mg
6%
Sodium
122mg
261mg
6%
Magnesium
43mg
26mg
4%
Calcium
50mg
14mg
4%
Vitamin A
54µg
21µg
4%
Vitamin E
0.55mg
4%
Selenium
34µg
31.7µg
4%
Vitamin B1
0.072mg
0.023mg
4%
Protein
18.62g
19.99g
3%
Vitamin D*
23 IU
3%
Vitamin D
0.6µg
3%
Vitamin B5
0.62mg
0.494mg
3%
Carbs
6.39g
0g
2%
Cholesterol
59mg
66mg
2%
Copper
0.042mg
0.026mg
2%
Manganese
0.05mg
0.013mg
2%
Vitamin B2
0.097mg
0.069mg
2%
Vitamin B6
0.3mg
0.327mg
2%
Zinc
0.48mg
0.4mg
1%
Folate
15µg
13µg
1%
Protein per 100 calories
8.2g
22g
N/A
Calories per 10 g protein
122kcal
45kcal
N/A
Weight per 100 calories
44g
111g
N/A
Unsaturated / Saturated Fat ratio
3
2.5
N/A
Net carbs
6.39g
0g
N/A
Vitamin K
0.1µg
0%
Trans fat
0.005g
N/A
Tryptophan
0.212mg
0.26mg
0%
Threonine
0.843mg
1.015mg
0%
Isoleucine
0.867mg
1.067mg
0%
Leucine
1.515mg
1.882mg
0%
Lysine
1.634mg
2.126mg
0%
Methionine
0.541mg
0.686mg
0%
Phenylalanine
0.75mg
0.904mg
0%
Valine
0.965mg
1.193mg
0%
Histidine
0.538mg
0.682mg
0%
Omega-3 - EPA
0.258g
0.051g
N/A
Omega-3 - DHA
0.431g
0.109g
N/A
Omega-3 - DPA
0.089g
0.006g
N/A
Omega-6 - Eicosadienoic acid
0.001g
N/A
Macronutrient Comparison
Macronutrient breakdown side-by-side comparison
3
19%
14%
6%
60%
Protein:
18.62 g
Fats:
13.82 g
Carbs:
6.39 g
Water:
60.09 g
Other:
1.08 g
2
20%
79%
Protein:
19.99 g
Fats:
0.55 g
Carbs:
0 g
Water:
79.65 g
Other:
0 g
Contains
more
Fats Fats
+2412.7%
Contains
more
Carbs Carbs
+∞%
Contains
more
Other Other
+∞%
Contains
more
Water Water
+32.6%
~equal in
Protein
~19.99g
Fat Type Comparison
Fat type breakdown side-by-side comparison
2
25%
46%
29%
Saturated fat:
Sat. Fat
3.205 g
Monounsaturated fat:
Mono. Fat
5.935 g
Polyunsaturated fat:
Poly. Fat
3.701 g
1
29%
19%
52%
Saturated fat:
Sat. Fat
0.111 g
Monounsaturated fat:
Mono. Fat
0.074 g
Polyunsaturated fat:
Poly. Fat
0.204 g
Contains
more
Mono. Fat Monounsaturated fat
+7920.3%
Contains
more
Poly. Fat Polyunsaturated fat
+1714.2%
Contains
less
Sat. Fat Saturated fat
-96.5%