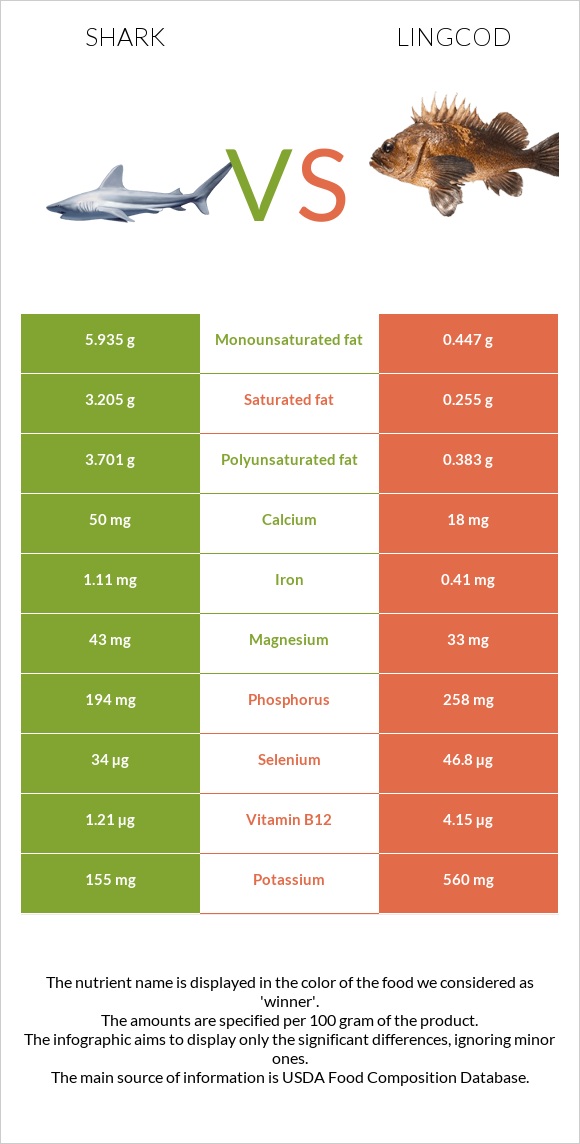
A recap on the differences between shark and lingcod Shark is higher in iron, monounsaturated fat, and polyunsaturated fat, yet lingcod is higher in vitamin B12, selenium, potassium, and phosphorus. Lingcod covers your daily vitamin B12 needs 123% more than shark. Shark contains 13 times more monounsaturated fat than lingcod. While shark contains 5.935g of monounsaturated fat, lingcod contains only 0.447g. The amount of saturated fat in lingcod is lower. Food varieties used in this article are Fish, shark, mixed species, cooked, batter-dipped and fried and Fish, lingcod, cooked, dry heat .
Infographic
Mineral Comparison
Mineral comparison score is based on the number of minerals by which one or the other food is richer. The "coverage" charts below show how much of the daily needs can be covered by 300 grams of the food.
5
100 g
300 g
3 oz - 85g
Magnesium
Magnesium
Calcium
Calcium
Potassium
Potassium
Iron
Iron
Copper
Copper
Zinc
Zinc
Phosphorus
Phosphorus
Sodium
Sodium
Manganese
Manganese
Selenium
Selenium
31%
15%
14%
42%
14%
13%
83%
16%
6.5%
185%
5
100 g
300 g
3 oz - 85g 0.5 fillet - 151g
Magnesium
Magnesium
Calcium
Calcium
Potassium
Potassium
Iron
Iron
Copper
Copper
Zinc
Zinc
Phosphorus
Phosphorus
Sodium
Sodium
Manganese
Manganese
Selenium
Selenium
24%
5.4%
49%
15%
12%
16%
111%
9.9%
3.4%
255%
Vitamin Comparison
Vitamin comparison score is based on the number of vitamins by which one or the other food is richer. The "coverage" charts below show how much of the daily needs can be covered by 300 grams of the food.
4
100 g
300 g
3 oz - 85g
Vitamin C
Vit. C
Vitamin D
Vit. D
Vitamin A
Vit. A
Vitamin E
Vit. E
Vitamin B1
Vit. B1
Vitamin B2
Vit. B2
Vitamin B3
Vit. B3
Vitamin B5
Vit. B5
Vitamin B6
Vit. B6
Vitamin B12
Vit. B12
Vitamin K
Vit. K
Folate
Folate
0%
0%
18%
0%
18%
22%
52%
37%
69%
151%
0%
11%
4
100 g
300 g
3 oz - 85g 0.5 fillet - 151g
Vitamin C
Vit. C
Vitamin D
Vit. D
Vitamin A
Vit. A
Vitamin E
Vit. E
Vitamin B1
Vit. B1
Vitamin B2
Vit. B2
Vitamin B3
Vit. B3
Vitamin B5
Vit. B5
Vitamin B6
Vit. B6
Vitamin B12
Vit. B12
Vitamin K
Vit. K
Folate
Folate
0%
0%
5.7%
0%
8.8%
32%
43%
52%
80%
519%
0%
7.5%
All nutrients comparison - raw data values
Nutrient
DV% diff.
Vitamin B12
1.21µg
4.15µg
123%
Selenium
34µg
46.8µg
23%
Polyunsaturated fat
3.701g
0.383g
22%
Fats
13.82g
1.36g
19%
Monounsaturated fat
5.935g
0.447g
14%
Saturated fat
3.205g
0.255g
13%
Potassium
155mg
560mg
12%
Iron
1.11mg
0.41mg
9%
Phosphorus
194mg
258mg
9%
Protein
18.62g
22.64g
8%
Calories
228kcal
109kcal
6%
Vitamin B5
0.62mg
0.865mg
5%
Vitamin A
54µg
17µg
4%
Vitamin B6
0.3mg
0.346mg
4%
Cholesterol
59mg
67mg
3%
Calcium
50mg
18mg
3%
Vitamin B1
0.072mg
0.035mg
3%
Vitamin B2
0.097mg
0.139mg
3%
Vitamin B3
2.783mg
2.314mg
3%
Carbs
6.39g
0g
2%
Magnesium
43mg
33mg
2%
Sodium
122mg
76mg
2%
Copper
0.042mg
0.035mg
1%
Zinc
0.48mg
0.58mg
1%
Manganese
0.05mg
0.026mg
1%
Folate
15µg
10µg
1%
Protein per 100 calories
8.2g
21g
N/A
Calories per 10 g protein
122kcal
48kcal
N/A
Weight per 100 calories
44g
92g
N/A
Unsaturated / Saturated Fat ratio
3
3.3
N/A
Net carbs
6.39g
0g
N/A
Tryptophan
0.212mg
0.254mg
0%
Threonine
0.843mg
0.993mg
0%
Isoleucine
0.867mg
1.043mg
0%
Leucine
1.515mg
1.84mg
0%
Lysine
1.634mg
2.079mg
0%
Methionine
0.541mg
0.67mg
0%
Phenylalanine
0.75mg
0.884mg
0%
Valine
0.965mg
1.166mg
0%
Histidine
0.538mg
0.667mg
0%
Omega-3 - EPA
0.258g
0.133g
N/A
Omega-3 - DHA
0.431g
0.13g
N/A
Omega-3 - DPA
0.089g
0.018g
N/A
Macronutrient Comparison
Macronutrient breakdown side-by-side comparison
3
19%
14%
6%
60%
Protein:
18.62 g
Fats:
13.82 g
Carbs:
6.39 g
Water:
60.09 g
Other:
1.08 g
2
23%
76%
Protein:
22.64 g
Fats:
1.36 g
Carbs:
0 g
Water:
75.68 g
Other:
0.32 g
Contains
more
Fats Fats
+916.2%
Contains
more
Carbs Carbs
+∞%
Contains
more
Other Other
+237.5%
Contains
more
Protein Protein
+21.6%
Contains
more
Water Water
+25.9%
Fat Type Comparison
Fat type breakdown side-by-side comparison
2
25%
46%
29%
Saturated fat:
Sat. Fat
3.205 g
Monounsaturated fat:
Mono. Fat
5.935 g
Polyunsaturated fat:
Poly. Fat
3.701 g
1
24%
41%
35%
Saturated fat:
Sat. Fat
0.255 g
Monounsaturated fat:
Mono. Fat
0.447 g
Polyunsaturated fat:
Poly. Fat
0.383 g
Contains
more
Mono. Fat Monounsaturated fat
+1227.7%
Contains
more
Poly. Fat Polyunsaturated fat
+866.3%
Contains
less
Sat. Fat Saturated fat
-92%