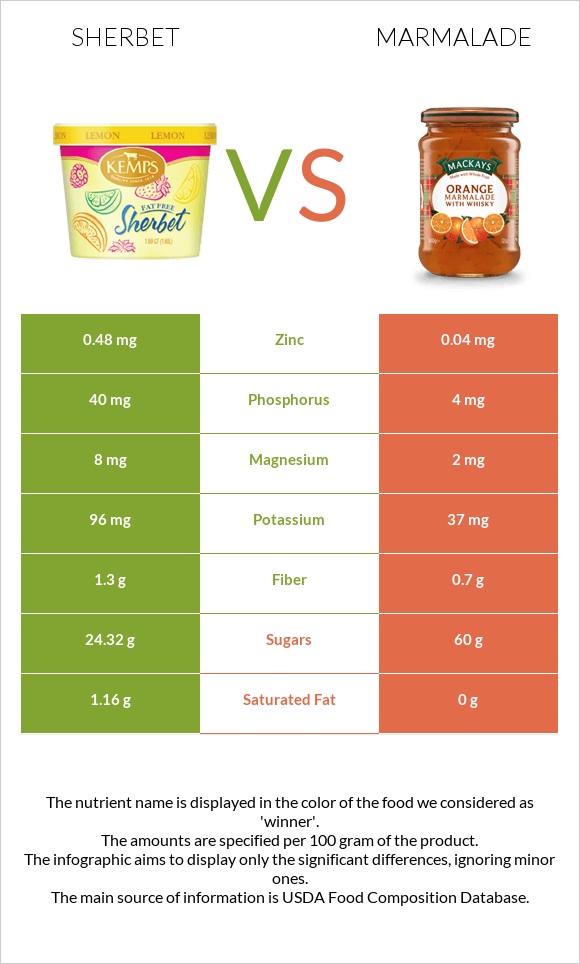
Significant differences between sherbet and marmalade Sherbet has more vitamin B2, vitamin B12, and phosphorus; however, marmalade is richer in copper. Sherbet has a higher glycemic index. The glycemic index of sherbet is 59, while the glycemic index of marmalade is 43. Specific food types used in this comparison are Sherbet, orange and Marmalade, orange .
Infographic
Mineral Comparison
Mineral comparison score is based on the number of minerals by which one or the other food is richer. The "coverage" charts below show how much of the daily needs can be covered by 300 grams of the food.
7
100 g
300 g
1 bar (2.75 fl oz) - 66g 0.5 cup (4 fl oz) - 74g
Magnesium
Magnesium
Calcium
Calcium
Potassium
Potassium
Iron
Iron
Copper
Copper
Zinc
Zinc
Phosphorus
Phosphorus
Sodium
Sodium
Manganese
Manganese
Selenium
Selenium
5.7%
16%
8.5%
5.3%
9.3%
13%
17%
6%
1.4%
8.2%
2
100 g
300 g
1 package (0.5 oz) - 14g 1 tbsp - 20g 1 serving - 20g 1 cup - 320g
Magnesium
Magnesium
Calcium
Calcium
Potassium
Potassium
Iron
Iron
Copper
Copper
Zinc
Zinc
Phosphorus
Phosphorus
Sodium
Sodium
Manganese
Manganese
Selenium
Selenium
1.4%
11%
3.3%
5.6%
30%
1.1%
1.7%
7.3%
2.6%
3.3%
Vitamin Comparison
Vitamin comparison score is based on the number of vitamins by which one or the other food is richer. The "coverage" charts below show how much of the daily needs can be covered by 300 grams of the food.
7
100 g
300 g
1 bar (2.75 fl oz) - 66g 0.5 cup (4 fl oz) - 74g
Vitamin C
Vit. C
Vitamin D
Vit. D
Vitamin A
Vit. A
Vitamin E
Vit. E
Vitamin B1
Vit. B1
Vitamin B2
Vit. B2
Vitamin B3
Vit. B3
Vitamin B5
Vit. B5
Vitamin B6
Vit. B6
Vitamin B12
Vit. B12
Vitamin K
Vit. K
Folate
Folate
7.7%
0%
4%
0.2%
6.8%
22%
1.2%
13%
5.3%
16%
0%
3%
3
100 g
300 g
1 package (0.5 oz) - 14g 1 tbsp - 20g 1 serving - 20g 1 cup - 320g
Vitamin C
Vit. C
Vitamin D
Vit. D
Vitamin A
Vit. A
Vitamin E
Vit. E
Vitamin B1
Vit. B1
Vitamin B2
Vit. B2
Vitamin B3
Vit. B3
Vitamin B5
Vit. B5
Vitamin B6
Vit. B6
Vitamin B12
Vit. B12
Vitamin K
Vit. K
Folate
Folate
16%
0%
1%
1.2%
1.3%
5.8%
0.98%
0.9%
4.4%
0%
0%
6.8%
All nutrients comparison - raw data values
Nutrient
DV% diff.
Carbs
30.4g
66.3g
12%
Copper
0.028mg
0.09mg
7%
Vitamin B2
0.097mg
0.025mg
6%
Calories
144kcal
246kcal
5%
Phosphorus
40mg
4mg
5%
Vitamin B12
0.13µg
0µg
5%
Saturated fat
1.16g
0g
5%
Zinc
0.48mg
0.04mg
4%
Vitamin B5
0.224mg
0.015mg
4%
Fats
2g
0g
3%
Vitamin C
2.3mg
4.8mg
3%
Protein
1.1g
0.3g
2%
Calcium
54mg
38mg
2%
Potassium
96mg
37mg
2%
Fiber
1.3g
0.7g
2%
Selenium
1.5µg
0.6µg
2%
Vitamin B1
0.027mg
0.005mg
2%
Magnesium
8mg
2mg
1%
Vitamin A
12µg
3µg
1%
Folate
4µg
9µg
1%
Choline
7.7mg
3mg
1%
Monounsaturated fat
0.53g
0g
1%
Polyunsaturated fat
0.08g
0g
1%
Weight per 100 calories
69g
41g
N/A
Net carbs
29.1g
65.6g
N/A
Cholesterol
1mg
0mg
0%
Iron
0.14mg
0.15mg
0%
Sugar
24.32g
60g
N/A
Sodium
46mg
56mg
0%
Vitamin E
0.01mg
0.06mg
0%
Manganese
0.011mg
0.02mg
0%
Vitamin B3
0.063mg
0.052mg
0%
Vitamin B6
0.023mg
0.019mg
0%
Tryptophan
0.003mg
0%
Threonine
0.005mg
0%
Isoleucine
0.008mg
0%
Leucine
0.007mg
0%
Lysine
0.015mg
0%
Methionine
0.006mg
0%
Phenylalanine
0.01mg
0%
Valine
0.013mg
0%
Histidine
0.006mg
0%
Macronutrient Comparison
Macronutrient breakdown side-by-side comparison
4
2%
30%
66%
Protein:
1.1 g
Fats:
2 g
Carbs:
30.4 g
Water:
66.1 g
Other:
0.4 g
1
66%
33%
Protein:
0.3 g
Fats:
0 g
Carbs:
66.3 g
Water:
33.2 g
Other:
0.2 g
Contains
more
Protein Protein
+266.7%
Contains
more
Fats Fats
+∞%
Contains
more
Water Water
+99.1%
Contains
more
Other Other
+100%
Contains
more
Carbs Carbs
+118.1%