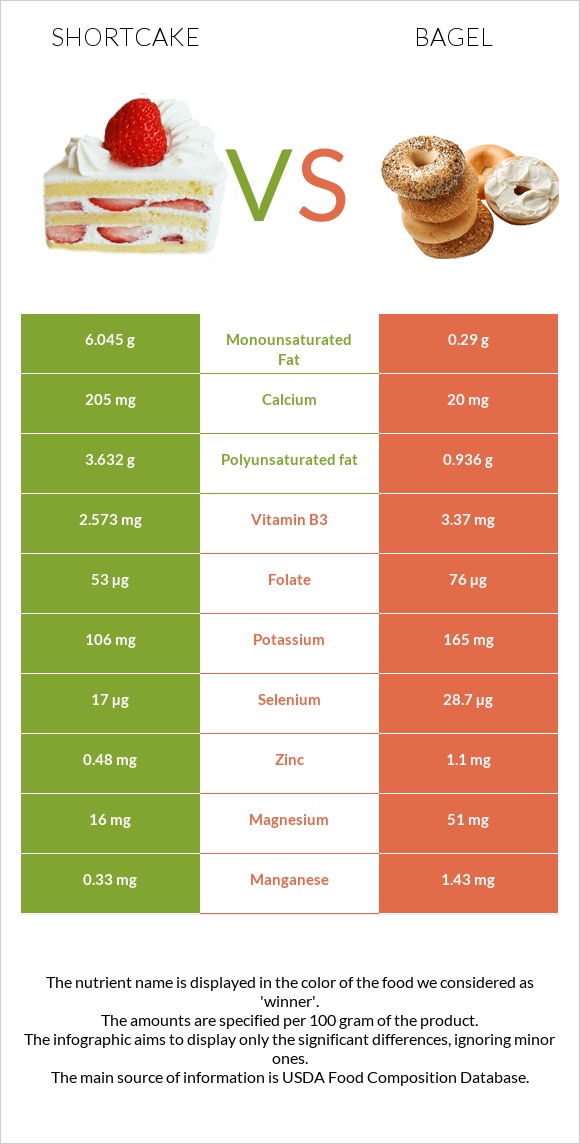
The main differences between shortcake and bagel Shortcake is richer in calcium, yet bagel is richer in manganese, selenium, copper, vitamin B6, magnesium, vitamin B1, folate, and zinc. Daily need coverage for manganese for bagel is 48% higher. Food types used in this article are Cake, shortcake, biscuit-type, prepared from recipe and Bagels, wheat .
Infographic
Mineral Comparison
Mineral comparison score is based on the number of minerals by which one or the other food is richer. The "coverage" charts below show how much of the daily needs can be covered by 300 grams of the food.
1
100 g
300 g
1 oz - 28.35g
Magnesium
Magnesium
Calcium
Calcium
Potassium
Potassium
Iron
Iron
Copper
Copper
Zinc
Zinc
Phosphorus
Phosphorus
Sodium
Sodium
Manganese
Manganese
Selenium
Selenium
11%
62%
9.4%
95%
25%
13%
61%
66%
43%
93%
7
100 g
300 g
1 bagel - 98g
Magnesium
Magnesium
Calcium
Calcium
Potassium
Potassium
Iron
Iron
Copper
Copper
Zinc
Zinc
Phosphorus
Phosphorus
Sodium
Sodium
Manganese
Manganese
Selenium
Selenium
36%
6%
15%
104%
58%
30%
61%
57%
187%
157%
Vitamin Comparison
Vitamin comparison score is based on the number of vitamins by which one or the other food is richer. The "coverage" charts below show how much of the daily needs can be covered by 300 grams of the food.
4
100 g
300 g
1 oz - 28.35g
Vitamin C
Vit. C
Vitamin D
Vit. D
Vitamin A
Vit. A
Vitamin E
Vit. E
Vitamin B1
Vit. B1
Vitamin B2
Vit. B2
Vitamin B3
Vit. B3
Vitamin B5
Vit. B5
Vitamin B6
Vit. B6
Vitamin B12
Vit. B12
Vitamin K
Vit. K
Folate
Folate
0.67%
0%
6%
0%
78%
63%
48%
15%
6.9%
8.8%
0%
40%
7
100 g
300 g
1 bagel - 98g
Vitamin C
Vit. C
Vitamin D
Vit. D
Vitamin A
Vit. A
Vitamin E
Vit. E
Vitamin B1
Vit. B1
Vitamin B2
Vit. B2
Vitamin B3
Vit. B3
Vitamin B5
Vit. B5
Vitamin B6
Vit. B6
Vitamin B12
Vit. B12
Vitamin K
Vit. K
Folate
Folate
0%
0%
0%
6.4%
101%
48%
63%
23%
34%
0%
3.8%
57%
All nutrients comparison - raw data values
Nutrient
DV% diff.
Manganese
0.33mg
1.43mg
48%
Selenium
17µg
28.7µg
21%
Fats
14.2g
1.53g
19%
Calcium
205mg
20mg
19%
Polyunsaturated fat
3.632g
0.936g
18%
Saturated fat
3.772g
0g
17%
Fiber
4.1g
16%
Monounsaturated fat
6.045g
0.29g
14%
Copper
0.076mg
0.175mg
11%
Vitamin B6
0.03mg
0.147mg
9%
Protein
6.1g
10.2g
8%
Magnesium
16mg
51mg
8%
Vitamin B1
0.311mg
0.403mg
8%
Zinc
0.48mg
1.1mg
6%
Folate
53µg
76µg
6%
Calories
346kcal
250kcal
5%
Vitamin B2
0.272mg
0.209mg
5%
Vitamin B3
2.573mg
3.37mg
5%
Iron
2.54mg
2.76mg
3%
Sodium
506mg
439mg
3%
Vitamin B5
0.248mg
0.375mg
3%
Vitamin B12
0.07µg
0µg
3%
Potassium
106mg
165mg
2%
Vitamin A
18µg
0µg
2%
Vitamin E
0.32mg
2%
Choline
9.8mg
2%
Cholesterol
3mg
0mg
1%
Vitamin K
1.5µg
1%
Protein per 100 calories
1.8g
4.1g
N/A
Calories per 10 g protein
567kcal
245kcal
N/A
Weight per 100 calories
29g
40g
N/A
Unsaturated / Saturated Fat ratio
2.6
N/A
Vitamin C
0.2mg
0mg
0%
Net carbs
48.5g
44.79g
N/A
Carbs
48.5g
48.89g
0%
Sugar
6.12g
N/A
Phosphorus
143mg
142mg
0%
Tryptophan
0.076mg
0%
Threonine
0.184mg
0%
Isoleucine
0.238mg
0%
Leucine
0.449mg
0%
Lysine
0.197mg
0%
Methionine
0.115mg
0%
Phenylalanine
0.302mg
0%
Valine
0.273mg
0%
Histidine
0.14mg
0%
Macronutrient Comparison
Macronutrient breakdown side-by-side comparison
2
6%
14%
49%
28%
3%
Protein:
6.1 g
Fats:
14.2 g
Carbs:
48.5 g
Water:
28.4 g
Other:
2.8 g
3
10%
49%
38%
2%
Protein:
10.2 g
Fats:
1.53 g
Carbs:
48.89 g
Water:
37.55 g
Other:
1.83 g
Contains
more
Fats Fats
+828.1%
Contains
more
Other Other
+53%
Contains
more
Protein Protein
+67.2%
Contains
more
Water Water
+32.2%
Fat Type Comparison
Fat type breakdown side-by-side comparison
2
28%
45%
27%
Saturated fat:
Sat. Fat
3.772 g
Monounsaturated fat:
Mono. Fat
6.045 g
Polyunsaturated fat:
Poly. Fat
3.632 g
1
24%
76%
Saturated fat:
Sat. Fat
0 g
Monounsaturated fat:
Mono. Fat
0.29 g
Polyunsaturated fat:
Poly. Fat
0.936 g
Contains
more
Mono. Fat Monounsaturated fat
+1984.5%
Contains
more
Poly. Fat Polyunsaturated fat
+288%
Contains
less
Sat. Fat Saturated fat
-100%