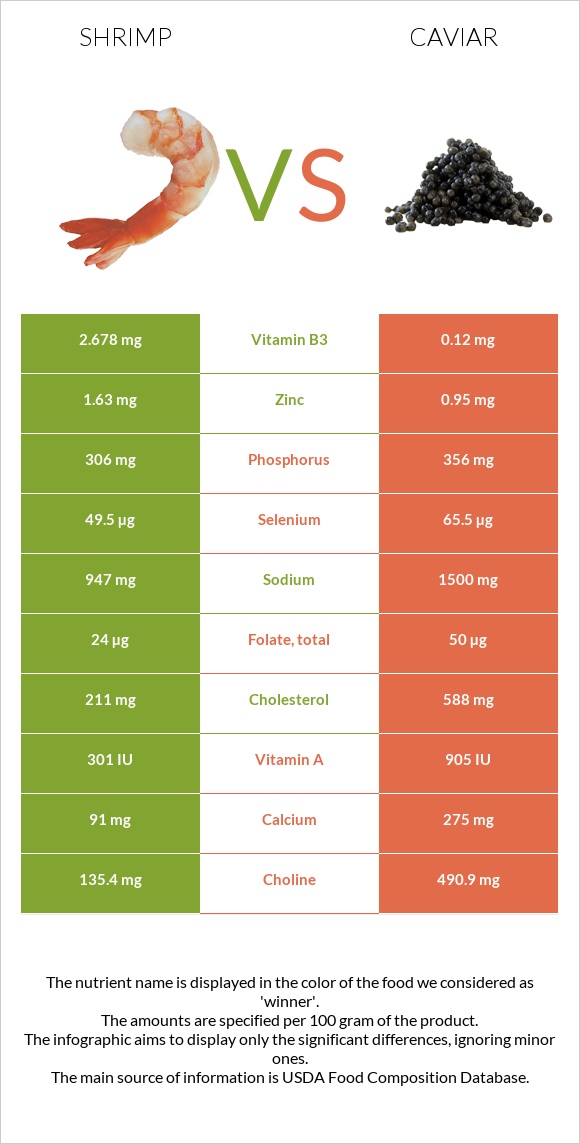
Summary of differences between shrimp and caviar The amount of vitamin B12, iron, choline, magnesium, vitamin B5, vitamin B2, selenium, and calcium in caviar is higher than in shrimp. Caviar covers your daily need for vitamin B12, 764% more than shrimp. The amount of sodium in shrimp is lower. Caviar has a lower glycemic index. The glycemic index of caviar is 0, while the glycemic index of shrimp is 50. These are the specific foods used in this comparison Crustaceans, shrimp, mixed species, cooked, moist heat (may have been previously frozen) and Fish, caviar, black, and red, granular .
Infographic
Mineral Comparison
Mineral comparison score is based on the number of minerals by which one or the other food is richer. The "coverage" charts below show how much of the daily needs can be covered by 300 grams of the food.
3
100 g
300 g
4 large - 22g 3 oz - 85g
Magnesium
Magnesium
Calcium
Calcium
Potassium
Potassium
Iron
Iron
Copper
Copper
Zinc
Zinc
Phosphorus
Phosphorus
Sodium
Sodium
Manganese
Manganese
Selenium
Selenium
26%
27%
15%
12%
86%
44%
131%
124%
6.4%
270%
5
100 g
300 g
1 tbsp - 16g 1 oz - 28.35g
Magnesium
Magnesium
Calcium
Calcium
Potassium
Potassium
Iron
Iron
Copper
Copper
Zinc
Zinc
Phosphorus
Phosphorus
Sodium
Sodium
Manganese
Manganese
Selenium
Selenium
214%
83%
16%
446%
37%
26%
153%
196%
6.5%
357%
Vitamin Comparison
Vitamin comparison score is based on the number of vitamins by which one or the other food is richer. The "coverage" charts below show how much of the daily needs can be covered by 300 grams of the food.
2
100 g
300 g
4 large - 22g 3 oz - 85g
Vitamin C
Vit. C
Vitamin D
Vit. D
Vitamin A
Vit. A
Vitamin E
Vit. E
Vitamin B1
Vit. B1
Vitamin B2
Vit. B2
Vitamin B3
Vit. B3
Vitamin B5
Vit. B5
Vitamin B6
Vit. B6
Vitamin B12
Vit. B12
Vitamin K
Vit. K
Folate
Folate
0%
1.5%
30%
44%
8%
5.5%
50%
31%
56%
208%
1%
18%
9
100 g
300 g
1 tbsp - 16g 1 oz - 28.35g
Vitamin C
Vit. C
Vitamin D
Vit. D
Vitamin A
Vit. A
Vitamin E
Vit. E
Vitamin B1
Vit. B1
Vitamin B2
Vit. B2
Vitamin B3
Vit. B3
Vitamin B5
Vit. B5
Vitamin B6
Vit. B6
Vitamin B12
Vit. B12
Vitamin K
Vit. K
Folate
Folate
0%
44%
90%
38%
48%
143%
2.3%
210%
74%
2500%
1.5%
38%
All nutrients comparison - raw data values
Nutrient
DV% diff.
Vitamin B12
1.66µg
20µg
764%
Iron
0.32mg
11.88mg
145%
Cholesterol
211mg
588mg
126%
Choline
135.4mg
490.9mg
65%
Magnesium
37mg
300mg
63%
Vitamin B5
0.519mg
3.5mg
60%
Vitamin B2
0.024mg
0.62mg
46%
Polyunsaturated fat
0.59g
7.405g
45%
Selenium
49.5µg
65.5µg
29%
Fats
1.7g
17.9g
25%
Sodium
947mg
1500mg
24%
Vitamin A
90µg
271µg
20%
Calcium
91mg
275mg
18%
Copper
0.258mg
0.11mg
16%
Vitamin B3
2.678mg
0.12mg
16%
Saturated fat
0.521g
4.06g
16%
Vitamin D*
4 IU
117 IU
14%
Vitamin D
0.1µg
2.9µg
14%
Vitamin B1
0.032mg
0.19mg
13%
Monounsaturated fat
0.361g
4.631g
11%
Calories
119kcal
264kcal
7%
Phosphorus
306mg
356mg
7%
Folate
24µg
50µg
7%
Zinc
1.63mg
0.95mg
6%
Vitamin B6
0.242mg
0.32mg
6%
Protein
22.78g
24.6g
4%
Vitamin E
2.2mg
1.89mg
2%
Carbs
1.52g
4g
1%
Protein per 100 calories
19g
9.3g
N/A
Calories per 10 g protein
52kcal
107kcal
N/A
Weight per 100 calories
84g
38g
N/A
Unsaturated / Saturated Fat ratio
1.8
3
N/A
Net carbs
1.52g
4g
N/A
Potassium
170mg
181mg
0%
Manganese
0.049mg
0.05mg
0%
Vitamin K
0.4µg
0.6µg
0%
Trans fat
0.035g
N/A
Tryptophan
0.26mg
0.323mg
0%
Threonine
0.904mg
1.263mg
0%
Isoleucine
1.05mg
1.035mg
0%
Leucine
1.95mg
2.133mg
0%
Lysine
2.172mg
1.834mg
0%
Methionine
0.665mg
0.646mg
0%
Phenylalanine
0.992mg
1.071mg
0%
Valine
1.067mg
1.263mg
0%
Histidine
0.501mg
0.649mg
0%
Omega-3 - EPA
0.135g
2.741g
N/A
Omega-3 - DHA
0.141g
3.8g
N/A
Omega-3 - DPA
0.012g
0.229g
N/A
Omega-6 - Eicosadienoic acid
0.012g
N/A
Macronutrient Comparison
Macronutrient breakdown side-by-side comparison
1
23%
2%
72%
2%
Protein:
22.78 g
Fats:
1.7 g
Carbs:
1.52 g
Water:
71.56 g
Other:
2.44 g
4
25%
18%
4%
48%
6%
Protein:
24.6 g
Fats:
17.9 g
Carbs:
4 g
Water:
47.5 g
Other:
6 g
Contains
more
Water Water
+50.7%
Contains
more
Fats Fats
+952.9%
Contains
more
Carbs Carbs
+163.2%
Contains
more
Other Other
+145.9%
Fat Type Comparison
Fat type breakdown side-by-side comparison
1
35%
25%
40%
Saturated fat:
Sat. Fat
0.521 g
Monounsaturated fat:
Mono. Fat
0.361 g
Polyunsaturated fat:
Poly. Fat
0.59 g
2
25%
29%
46%
Saturated fat:
Sat. Fat
4.06 g
Monounsaturated fat:
Mono. Fat
4.631 g
Polyunsaturated fat:
Poly. Fat
7.405 g
Contains
less
Sat. Fat Saturated fat
-87.2%
Contains
more
Mono. Fat Monounsaturated fat
+1182.8%
Contains
more
Poly. Fat Polyunsaturated fat
+1155.1%