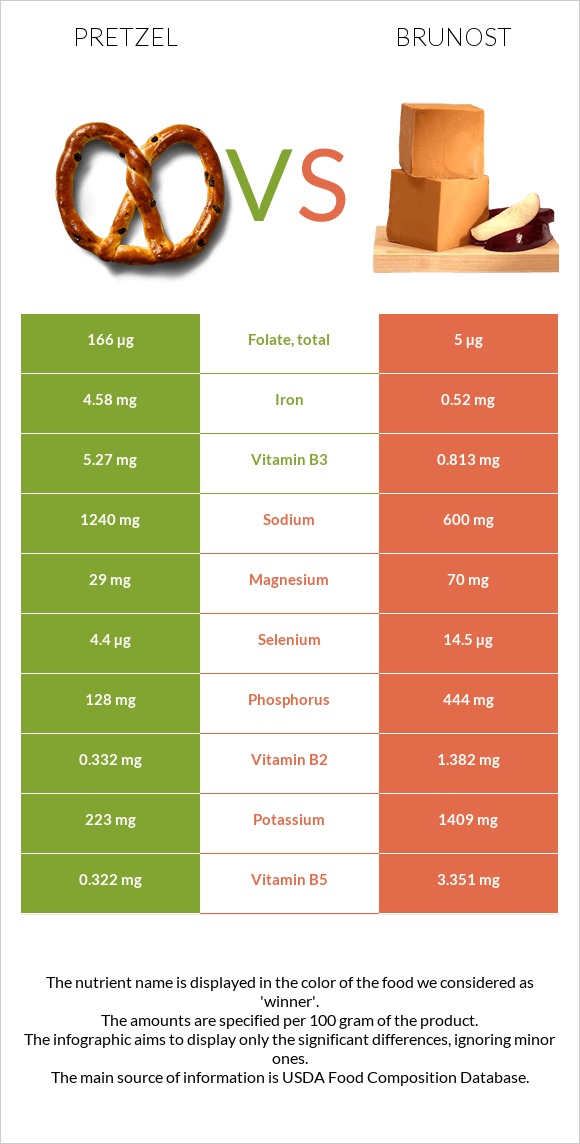
How are pretzel and brunost different? Pretzel is richer in iron, manganese, and folate, while brunost is higher in vitamin B12, vitamin B2, vitamin B5, phosphorus, calcium, and potassium. Brunost covers your daily need for vitamin B12, 101% more than pretzel. Pretzel contains 33 times more folate than brunost. Pretzel contains 166µg of folate, while brunost contains 5µg. Pretzel is lower in saturated fat. Pretzel has a higher glycemic index (83) than brunost (27). Snacks, pretzels, hard, plain, salted and Cheese, gjetost types were used in this article.
Infographic
Mineral Comparison
Mineral comparison score is based on the number of minerals by which one or the other food is richer. The "coverage" charts below show how much of the daily needs can be covered by 300 grams of the food.
3
100 g
300 g
1 oz - 28.35g 10 twists - 60g
Magnesium
Magnesium
Calcium
Calcium
Potassium
Potassium
Iron
Iron
Copper
Copper
Zinc
Zinc
Phosphorus
Phosphorus
Sodium
Sodium
Manganese
Manganese
Selenium
Selenium
21%
8.1%
20%
172%
52%
28%
55%
162%
132%
24%
6
100 g
300 g
1 oz - 28.35g 1 package (8 oz) - 227g
Magnesium
Magnesium
Calcium
Calcium
Potassium
Potassium
Iron
Iron
Copper
Copper
Zinc
Zinc
Phosphorus
Phosphorus
Sodium
Sodium
Manganese
Manganese
Selenium
Selenium
50%
120%
124%
20%
27%
31%
190%
78%
5.2%
79%
Vitamin Comparison
Vitamin comparison score is based on the number of vitamins by which one or the other food is richer. The "coverage" charts below show how much of the daily needs can be covered by 300 grams of the food.
6
100 g
300 g
1 oz - 28.35g 10 twists - 60g
Vitamin C
Vit. C
Vitamin D
Vit. D
Vitamin A
Vit. A
Vitamin E
Vit. E
Vitamin B1
Vit. B1
Vitamin B2
Vit. B2
Vitamin B3
Vit. B3
Vitamin B5
Vit. B5
Vitamin B6
Vit. B6
Vitamin B12
Vit. B12
Vitamin K
Vit. K
Folate
Folate
7%
0%
0%
9.4%
106%
77%
99%
19%
17%
0%
7%
125%
5
100 g
300 g
1 oz - 28.35g 1 package (8 oz) - 227g
Vitamin C
Vit. C
Vitamin D
Vit. D
Vitamin A
Vit. A
Vitamin E
Vit. E
Vitamin B1
Vit. B1
Vitamin B2
Vit. B2
Vitamin B3
Vit. B3
Vitamin B5
Vit. B5
Vitamin B6
Vit. B6
Vitamin B12
Vit. B12
Vitamin K
Vit. K
Folate
Folate
0%
0%
111%
0%
79%
319%
15%
201%
63%
303%
0%
3.8%
All nutrients comparison - raw data values
Nutrient
DV% diff.
Vitamin B12
0µg
2.42µg
101%
Saturated fat
0.391g
19.16g
85%
Vitamin B2
0.332mg
1.382mg
81%
Vitamin B5
0.322mg
3.351mg
61%
Iron
4.58mg
0.52mg
51%
Phosphorus
128mg
444mg
45%
Manganese
1.015mg
0.04mg
42%
Fats
2.93g
29.51g
41%
Folate
166µg
5µg
40%
Calcium
27mg
400mg
37%
Vitamin A
0µg
334µg
37%
Potassium
223mg
1409mg
35%
Cholesterol
0mg
94mg
31%
Starch
72.58g
30%
Sodium
1240mg
600mg
28%
Vitamin B3
5.27mg
0.813mg
28%
Selenium
4.4µg
14.5µg
18%
Monounsaturated fat
0.727g
7.879g
18%
Vitamin B6
0.074mg
0.271mg
15%
Fiber
3.4g
0g
14%
Carbs
80.39g
42.65g
13%
Magnesium
29mg
70mg
10%
Vitamin B1
0.424mg
0.315mg
9%
Copper
0.156mg
0.08mg
8%
Choline
29.5mg
5%
Calories
384kcal
466kcal
4%
Vitamin E
0.47mg
3%
Vitamin C
2.1mg
0mg
2%
Vitamin K
2.8µg
2%
Polyunsaturated fat
1.291g
0.938g
2%
Protein
10.04g
9.65g
1%
Zinc
1.04mg
1.14mg
1%
Protein per 100 calories
2.6g
2.1g
N/A
Calories per 10 g protein
382kcal
483kcal
N/A
Weight per 100 calories
26g
21g
N/A
Unsaturated / Saturated Fat ratio
5.2
0.46
N/A
Net carbs
76.99g
42.65g
N/A
Sugar
2.21g
N/A
Trans fat
0.004g
N/A
Tryptophan
0.097mg
0.135mg
0%
Threonine
0.25mg
0.393mg
0%
Isoleucine
0.407mg
0.519mg
0%
Leucine
0.757mg
0.992mg
0%
Lysine
0.257mg
0.814mg
0%
Methionine
0.177mg
0.318mg
0%
Phenylalanine
0.52mg
0.54mg
0%
Valine
0.48mg
0.765mg
0%
Histidine
0.22mg
0.293mg
0%
Fructose
0.31g
0%
Omega-3 - ALA
0.063g
N/A
Omega-6 - Gamma-linoleic acid
0.001g
N/A
Omega-6 - Linoleic acid
1.223g
N/A
Macronutrient Comparison
Macronutrient breakdown side-by-side comparison
2
10%
3%
80%
3%
4%
Protein:
10.04 g
Fats:
2.93 g
Carbs:
80.39 g
Water:
3.13 g
Other:
3.51 g
3
10%
30%
43%
13%
5%
Protein:
9.65 g
Fats:
29.51 g
Carbs:
42.65 g
Water:
13.44 g
Other:
4.75 g
Contains
more
Carbs Carbs
+88.5%
Contains
more
Fats Fats
+907.2%
Contains
more
Water Water
+329.4%
Contains
more
Other Other
+35.3%
Fat Type Comparison
Fat type breakdown side-by-side comparison
2
16%
30%
54%
Saturated fat:
Sat. Fat
0.391 g
Monounsaturated fat:
Mono. Fat
0.727 g
Polyunsaturated fat:
Poly. Fat
1.291 g
1
68%
28%
3%
Saturated fat:
Sat. Fat
19.16 g
Monounsaturated fat:
Mono. Fat
7.879 g
Polyunsaturated fat:
Poly. Fat
0.938 g
Contains
less
Sat. Fat Saturated fat
-98%
Contains
more
Poly. Fat Polyunsaturated fat
+37.6%
Contains
more
Mono. Fat Monounsaturated fat
+983.8%