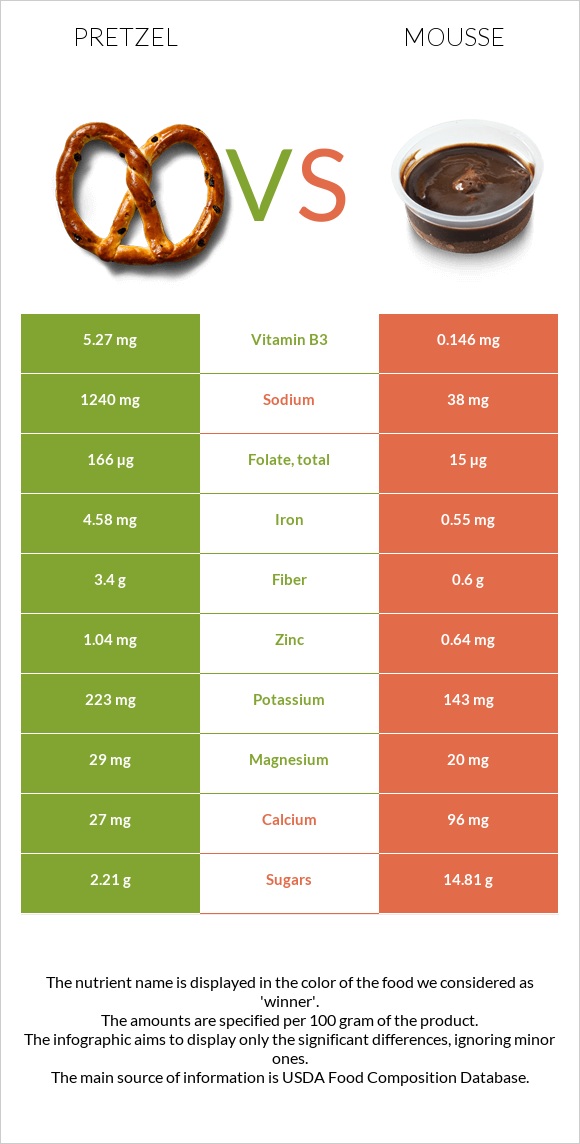
How are pretzel and mousse different? Pretzel is higher in iron, manganese, folate, vitamin B3, vitamin B1, and fiber; however, mousse is richer in vitamin B12. Daily need coverage for sodium for pretzel is 52% higher. Pretzel contains 36 times more vitamin B3 than mousse. While pretzel contains 5.27mg of vitamin B3, mousse contains only 0.146mg. Mousse has less sodium. Mousse has a lower glycemic index (42) than pretzel (83). Snacks, pretzels, hard, plain, salted and Desserts, mousse, chocolate, prepared-from-recipe are the varieties used in this article.
Infographic
Mineral Comparison
Mineral comparison score is based on the number of minerals by which one or the other food is richer. The "coverage" charts below show how much of the daily needs can be covered by 300 grams of the food.
6
100 g
300 g
1 oz - 28.35g 10 twists - 60g
Magnesium
Magnesium
Calcium
Calcium
Potassium
Potassium
Iron
Iron
Copper
Copper
Zinc
Zinc
Phosphorus
Phosphorus
Sodium
Sodium
Manganese
Manganese
Selenium
Selenium
21%
8.1%
20%
172%
52%
28%
55%
162%
132%
24%
3
100 g
300 g
0.5 cup - 202g 1 recipe yield - 808g
Magnesium
Magnesium
Calcium
Calcium
Potassium
Potassium
Iron
Iron
Copper
Copper
Zinc
Zinc
Phosphorus
Phosphorus
Sodium
Sodium
Manganese
Manganese
Selenium
Selenium
14%
29%
13%
21%
25%
17%
50%
5%
7.7%
40%
Vitamin Comparison
Vitamin comparison score is based on the number of vitamins by which one or the other food is richer. The "coverage" charts below show how much of the daily needs can be covered by 300 grams of the food.
7
100 g
300 g
1 oz - 28.35g 10 twists - 60g
Vitamin C
Vit. C
Vitamin D
Vit. D
Vitamin A
Vit. A
Vitamin E
Vit. E
Vitamin B1
Vit. B1
Vitamin B2
Vit. B2
Vitamin B3
Vit. B3
Vitamin B5
Vit. B5
Vitamin B6
Vit. B6
Vitamin B12
Vit. B12
Vitamin K
Vit. K
Folate
Folate
7%
0%
0%
9.4%
106%
77%
99%
19%
17%
0%
7%
125%
3
100 g
300 g
0.5 cup - 202g 1 recipe yield - 808g
Vitamin C
Vit. C
Vitamin D
Vit. D
Vitamin A
Vit. A
Vitamin E
Vit. E
Vitamin B1
Vit. B1
Vitamin B2
Vit. B2
Vitamin B3
Vit. B3
Vitamin B5
Vit. B5
Vitamin B6
Vit. B6
Vitamin B12
Vit. B12
Vitamin K
Vit. K
Folate
Folate
0.33%
0%
47%
10%
11%
47%
2.7%
32%
13%
59%
4%
11%
All nutrients comparison - raw data values
Nutrient
DV% diff.
Sodium
1240mg
38mg
52%
Iron
4.58mg
0.55mg
50%
Cholesterol
0mg
140mg
47%
Manganese
1.015mg
0.059mg
42%
Saturated fat
0.391g
9.151g
40%
Folate
166µg
15µg
38%
Vitamin B1
0.424mg
0.045mg
32%
Vitamin B3
5.27mg
0.146mg
32%
Starch
72.58g
30%
Carbs
80.39g
16.07g
21%
Fats
2.93g
16g
20%
Vitamin B12
0µg
0.47µg
20%
Vitamin A
0µg
140µg
16%
Protein
10.04g
4.14g
12%
Fiber
3.4g
0.6g
11%
Monounsaturated fat
0.727g
5.027g
11%
Vitamin B2
0.332mg
0.205mg
10%
Copper
0.156mg
0.075mg
9%
Calories
384kcal
225kcal
8%
Calcium
27mg
96mg
7%
Selenium
4.4µg
7.4µg
5%
Choline
29.5mg
5%
Zinc
1.04mg
0.64mg
4%
Vitamin B5
0.322mg
0.533mg
4%
Polyunsaturated fat
1.291g
0.879g
3%
Vitamin C
2.1mg
0.1mg
2%
Magnesium
29mg
20mg
2%
Potassium
223mg
143mg
2%
Phosphorus
128mg
117mg
2%
Caffeine
0mg
7mg
2%
Vitamin B6
0.074mg
0.058mg
1%
Vitamin K
2.8µg
1.6µg
1%
Protein per 100 calories
2.6g
1.8g
N/A
Calories per 10 g protein
382kcal
543kcal
N/A
Weight per 100 calories
26g
44g
N/A
Unsaturated / Saturated Fat ratio
5.2
0.65
N/A
Net carbs
76.99g
15.47g
N/A
Sugar
2.21g
14.81g
N/A
Vitamin E
0.47mg
0.51mg
0%
Trans fat
0.004g
N/A
Tryptophan
0.097mg
0%
Threonine
0.25mg
0%
Isoleucine
0.407mg
0%
Leucine
0.757mg
0%
Lysine
0.257mg
0%
Methionine
0.177mg
0%
Phenylalanine
0.52mg
0%
Valine
0.48mg
0%
Histidine
0.22mg
0%
Fructose
0.31g
0%
Omega-3 - EPA
0g
0.001g
N/A
Omega-3 - DHA
0g
0.01g
N/A
Omega-3 - ALA
0.063g
N/A
Omega-6 - Gamma-linoleic acid
0.001g
N/A
Omega-6 - Linoleic acid
1.223g
N/A
Macronutrient Comparison
Macronutrient breakdown side-by-side comparison
3
10%
3%
80%
3%
4%
Protein:
10.04 g
Fats:
2.93 g
Carbs:
80.39 g
Water:
3.13 g
Other:
3.51 g
2
4%
16%
16%
63%
Protein:
4.14 g
Fats:
16 g
Carbs:
16.07 g
Water:
62.94 g
Other:
0.85 g
Contains
more
Protein Protein
+142.5%
Contains
more
Carbs Carbs
+400.2%
Contains
more
Other Other
+312.9%
Contains
more
Fats Fats
+446.1%
Contains
more
Water Water
+1910.9%
Fat Type Comparison
Fat type breakdown side-by-side comparison
2
16%
30%
54%
Saturated fat:
Sat. Fat
0.391 g
Monounsaturated fat:
Mono. Fat
0.727 g
Polyunsaturated fat:
Poly. Fat
1.291 g
1
61%
33%
6%
Saturated fat:
Sat. Fat
9.151 g
Monounsaturated fat:
Mono. Fat
5.027 g
Polyunsaturated fat:
Poly. Fat
0.879 g
Contains
less
Sat. Fat Saturated fat
-95.7%
Contains
more
Poly. Fat Polyunsaturated fat
+46.9%
Contains
more
Mono. Fat Monounsaturated fat
+591.5%