Pretzel vs. Rose hips — In-Depth Nutrition Comparison
Compare
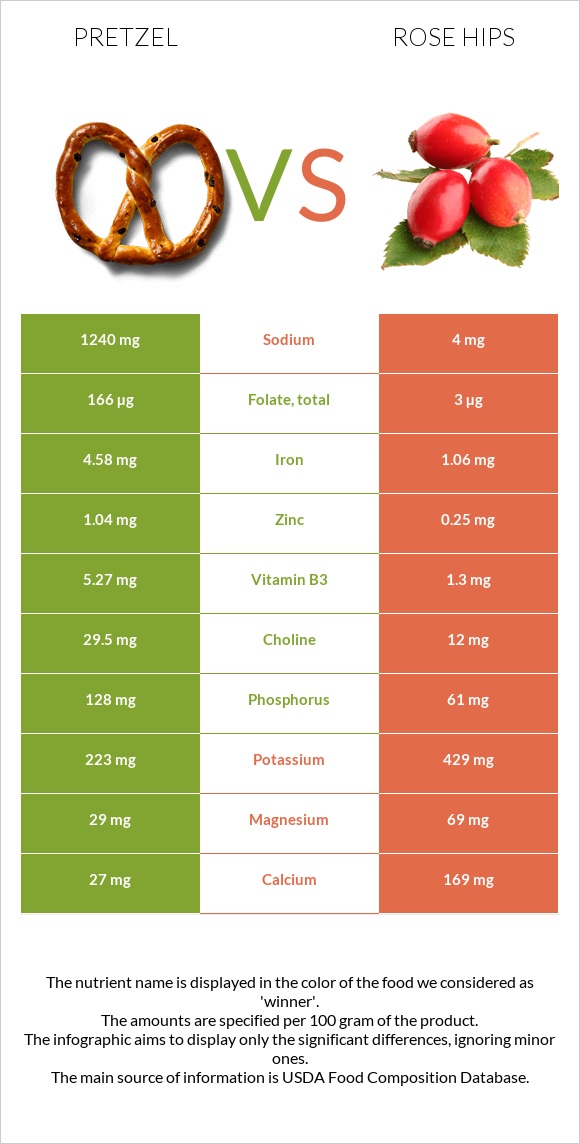
Significant differences between pretzel and rose hips
- Pretzel has more iron, folate, vitamin B1, and vitamin B3; however, rose hips are richer in vitamin C, vitamin A, fiber, vitamin E, and vitamin K.
- Rose hips cover your daily vitamin C needs 471% more than pretzel.
- Rose hips have 310 times less sodium than pretzel. Pretzel has 1240mg of sodium, while rose hips have 4mg.
- Pretzel has a higher glycemic index. The glycemic index of pretzel is 83, while the glycemic index of rose hips is 64.
Specific food types used in this comparison are Snacks, pretzels, hard, plain, salted and Rose Hips, wild (Northern Plains Indians).
Infographic
Infographic link
Mineral Comparison
Mineral comparison score is based on the number of minerals by which one or the other food is richer. The "coverage" charts below show how much of the daily needs can be covered by 300 grams of the food.
| Contains more IronIron | +332.1% |
| Contains more CopperCopper | +38.1% |
| Contains more ZincZinc | +316% |
| Contains more PhosphorusPhosphorus | +109.8% |
| Contains more SeleniumSelenium | +∞% |
| Contains more MagnesiumMagnesium | +137.9% |
| Contains more CalciumCalcium | +525.9% |
| Contains more PotassiumPotassium | +92.4% |
| Contains less SodiumSodium | -99.7% |
Vitamin Comparison
Vitamin comparison score is based on the number of vitamins by which one or the other food is richer. The "coverage" charts below show how much of the daily needs can be covered by 300 grams of the food.
| Contains more Vitamin B1Vitamin B1 | +2550% |
| Contains more Vitamin B2Vitamin B2 | +100% |
| Contains more Vitamin B3Vitamin B3 | +305.4% |
| Contains more FolateFolate | +5433.3% |
| Contains more Vitamin CVitamin C | +20185.7% |
| Contains more Vitamin AVitamin A | +∞% |
| Contains more Vitamin EVitamin E | +1142.6% |
| Contains more Vitamin B5Vitamin B5 | +148.4% |
| Contains more Vitamin KVitamin K | +825% |
All nutrients comparison - raw data values
| Nutrient |  |
 |
DV% diff. |
| Vitamin C | 2.1mg | 426mg | 471% |
| Fiber | 3.4g | 24.1g | 83% |
| Sodium | 1240mg | 4mg | 54% |
| Iron | 4.58mg | 1.06mg | 44% |
| Folate | 166µg | 3µg | 41% |
| Vitamin E | 0.47mg | 5.84mg | 36% |
| Vitamin B1 | 0.424mg | 0.016mg | 34% |
| Starch | 72.58g | 30% | |
| Vitamin B3 | 5.27mg | 1.3mg | 25% |
| Vitamin A | 0µg | 217µg | 24% |
| Vitamin K | 2.8µg | 25.9µg | 19% |
| Protein | 10.04g | 1.6g | 17% |
| Carbs | 80.39g | 38.22g | 14% |
| Calcium | 27mg | 169mg | 14% |
| Vitamin B2 | 0.332mg | 0.166mg | 13% |
| Calories | 384kcal | 162kcal | 11% |
| Magnesium | 29mg | 69mg | 10% |
| Phosphorus | 128mg | 61mg | 10% |
| Vitamin B5 | 0.322mg | 0.8mg | 10% |
| Polyunsaturated fat | 1.291g | 9% | |
| Selenium | 4.4µg | 8% | |
| Zinc | 1.04mg | 0.25mg | 7% |
| Potassium | 223mg | 429mg | 6% |
| Copper | 0.156mg | 0.113mg | 5% |
| Fats | 2.93g | 0.34g | 4% |
| Choline | 29.5mg | 12mg | 3% |
| Saturated fat | 0.391g | 2% | |
| Monounsaturated fat | 0.727g | 2% | |
| Fructose | 0.31g | 1.16g | 1% |
| Net carbs | 76.99g | 14.12g | N/A |
| Sugar | 2.21g | 2.58g | N/A |
| Manganese | 1.015mg | 1.02mg | 0% |
| Vitamin B6 | 0.074mg | 0.076mg | 0% |
| Trans fat | 0.004g | N/A | |
| Tryptophan | 0.097mg | 0% | |
| Threonine | 0.25mg | 0% | |
| Isoleucine | 0.407mg | 0% | |
| Leucine | 0.757mg | 0% | |
| Lysine | 0.257mg | 0% | |
| Methionine | 0.177mg | 0% | |
| Phenylalanine | 0.52mg | 0% | |
| Valine | 0.48mg | 0% | |
| Histidine | 0.22mg | 0% | |
| Omega-3 - ALA | 0.063g | N/A | |
| Omega-6 - Gamma-linoleic acid | 0.001g | N/A | |
| Omega-6 - Linoleic acid | 1.223g | N/A |
Macronutrient Comparison
Macronutrient breakdown side-by-side comparison
| Contains more ProteinProtein | +527.5% |
| Contains more FatsFats | +761.8% |
| Contains more CarbsCarbs | +110.3% |
| Contains more OtherOther | +197.5% |
| Contains more WaterWater | +1774.1% |
Carbohydrate type comparison
Carbohydrate type breakdown side-by-side comparison
| Contains more StarchStarch | +∞% |
| Contains more MaltoseMaltose | +∞% |
| Contains more SucroseSucrose | +∞% |
| Contains more GlucoseGlucose | +94.2% |
| Contains more FructoseFructose | +274.2% |
~equal in
Lactose
~0g
~equal in
Galactose
~0g


