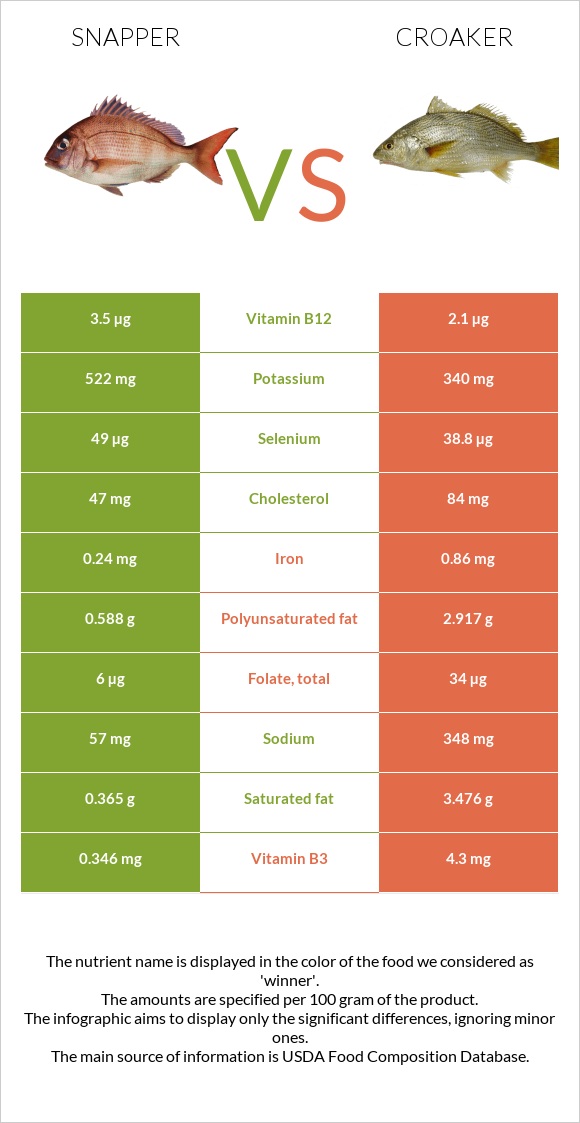
Summary of differences between snapper and croaker Snapper has more vitamin B12, selenium, and vitamin B6, while croaker has more vitamin B3, vitamin B2, iron, and folate. Snapper covers your daily need for vitamin B12, 58% more than croaker. Snapper contains 2 times more vitamin B6 than croaker. While snapper contains 0.46mg of vitamin B6, croaker contains only 0.26mg. The amount of cholesterol in snapper is lower. These are the specific foods used in this comparison Fish, snapper, mixed species, cooked, dry heat and Fish, croaker, Atlantic, cooked, breaded, and fried .
Infographic
Mineral Comparison
Mineral comparison score is based on the number of minerals by which one or the other food is richer. The "coverage" charts below show how much of the daily needs can be covered by 300 grams of the food.
4
100 g
300 g
3 oz - 85g 1 fillet - 170g
Magnesium
Magnesium
Calcium
Calcium
Potassium
Potassium
Iron
Iron
Copper
Copper
Zinc
Zinc
Phosphorus
Phosphorus
Sodium
Sodium
Manganese
Manganese
Selenium
Selenium
26%
12%
46%
9%
15%
12%
86%
7.4%
2.2%
267%
5
100 g
300 g
3 oz - 85g 1 fillet - 87g
Magnesium
Magnesium
Calcium
Calcium
Potassium
Potassium
Iron
Iron
Copper
Copper
Zinc
Zinc
Phosphorus
Phosphorus
Sodium
Sodium
Manganese
Manganese
Selenium
Selenium
30%
9.6%
30%
32%
22%
14%
93%
45%
10%
212%
Vitamin Comparison
Vitamin comparison score is based on the number of vitamins by which one or the other food is richer. The "coverage" charts below show how much of the daily needs can be covered by 300 grams of the food.
5
100 g
300 g
3 oz - 85g 1 fillet - 170g
Vitamin C
Vit. C
Vitamin D
Vit. D
Vitamin A
Vit. A
Vitamin E
Vit. E
Vitamin B1
Vit. B1
Vitamin B2
Vit. B2
Vitamin B3
Vit. B3
Vitamin B5
Vit. B5
Vitamin B6
Vit. B6
Vitamin B12
Vit. B12
Vitamin K
Vit. K
Folate
Folate
5.3%
0%
12%
0%
13%
0.92%
6.5%
52%
106%
438%
0%
4.5%
4
100 g
300 g
3 oz - 85g 1 fillet - 87g
Vitamin C
Vit. C
Vitamin D
Vit. D
Vitamin A
Vit. A
Vitamin E
Vit. E
Vitamin B1
Vit. B1
Vitamin B2
Vit. B2
Vitamin B3
Vit. B3
Vitamin B5
Vit. B5
Vitamin B6
Vit. B6
Vitamin B12
Vit. B12
Vitamin K
Vit. K
Folate
Folate
0%
0%
7.7%
0%
23%
30%
81%
44%
60%
263%
0%
26%
All nutrients comparison - raw data values
Nutrient
DV% diff.
Vitamin B12
3.5µg
2.1µg
58%
Vitamin B3
0.346mg
4.3mg
25%
Selenium
49µg
38.8µg
19%
Fats
1.72g
12.67g
17%
Protein
26.3g
18.2g
16%
Polyunsaturated fat
0.588g
2.917g
16%
Vitamin B6
0.46mg
0.26mg
15%
Saturated fat
0.365g
3.476g
14%
Sodium
57mg
348mg
13%
Cholesterol
47mg
84mg
12%
Monounsaturated fat
0.322g
5.32g
12%
Vitamin B2
0.004mg
0.13mg
10%
Iron
0.24mg
0.86mg
8%
Folate
6µg
34µg
7%
Calories
128kcal
221kcal
5%
Potassium
522mg
340mg
5%
Carbs
0g
7.54g
3%
Manganese
0.017mg
0.08mg
3%
Vitamin B1
0.053mg
0.09mg
3%
Vitamin B5
0.87mg
0.74mg
3%
Vitamin C
1.6mg
0mg
2%
Fiber
0g
0.4g
2%
Copper
0.046mg
0.065mg
2%
Phosphorus
201mg
217mg
2%
Magnesium
37mg
42mg
1%
Calcium
40mg
32mg
1%
Zinc
0.44mg
0.52mg
1%
Vitamin A
35µg
23µg
1%
Protein per 100 calories
21g
8.2g
N/A
Calories per 10 g protein
49kcal
121kcal
N/A
Weight per 100 calories
78g
45g
N/A
Unsaturated / Saturated Fat ratio
2.5
2.4
N/A
Net carbs
0g
7.14g
N/A
Tryptophan
0.294mg
0.208mg
0%
Threonine
1.153mg
0.788mg
0%
Isoleucine
1.212mg
0.847mg
0%
Leucine
2.137mg
1.48mg
0%
Lysine
2.415mg
1.571mg
0%
Methionine
0.778mg
0.525mg
0%
Phenylalanine
1.027mg
0.742mg
0%
Valine
1.355mg
0.947mg
0%
Histidine
0.774mg
0.525mg
0%
Omega-3 - EPA
0.048g
0.113g
N/A
Omega-3 - DHA
0.273g
0.089g
N/A
Omega-3 - DPA
0.022g
0.079g
N/A
Macronutrient Comparison
Macronutrient breakdown side-by-side comparison
2
26%
2%
70%
Protein:
26.3 g
Fats:
1.72 g
Carbs:
0 g
Water:
70.35 g
Other:
1.63 g
3
18%
13%
8%
60%
2%
Protein:
18.2 g
Fats:
12.67 g
Carbs:
7.54 g
Water:
59.76 g
Other:
1.83 g
Contains
more
Protein Protein
+44.5%
Contains
more
Water Water
+17.7%
Contains
more
Fats Fats
+636.6%
Contains
more
Carbs Carbs
+∞%
Contains
more
Other Other
+12.3%
Fat Type Comparison
Fat type breakdown side-by-side comparison
1
29%
25%
46%
Saturated fat:
Sat. Fat
0.365 g
Monounsaturated fat:
Mono. Fat
0.322 g
Polyunsaturated fat:
Poly. Fat
0.588 g
2
30%
45%
25%
Saturated fat:
Sat. Fat
3.476 g
Monounsaturated fat:
Mono. Fat
5.32 g
Polyunsaturated fat:
Poly. Fat
2.917 g
Contains
less
Sat. Fat Saturated fat
-89.5%
Contains
more
Mono. Fat Monounsaturated fat
+1552.2%
Contains
more
Poly. Fat Polyunsaturated fat
+396.1%