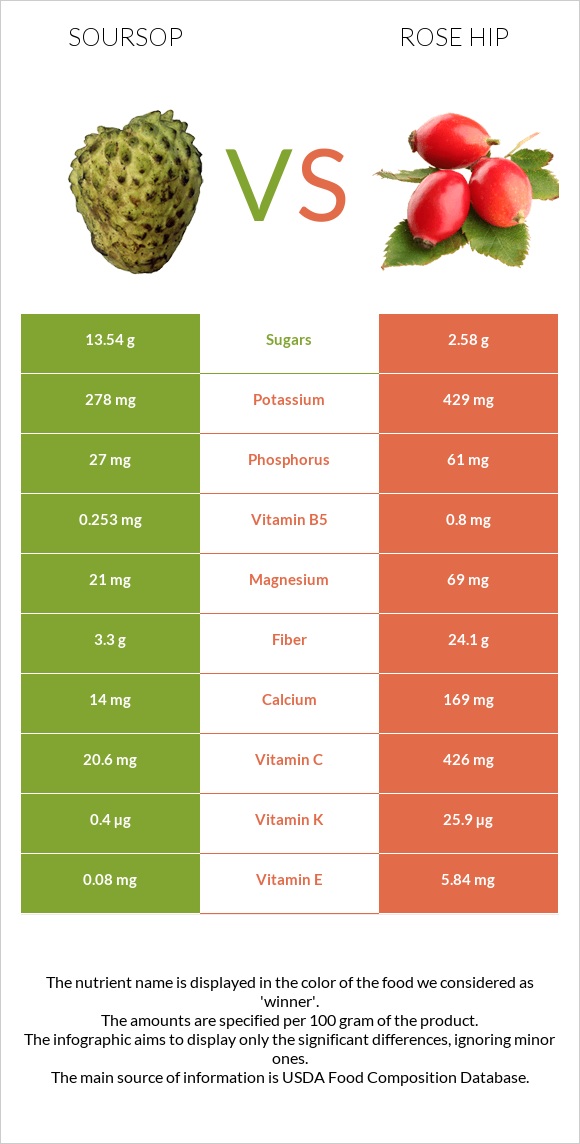
How are soursop and rose hips different? Rose hips are higher than soursop in vitamin C, vitamin A, fiber, vitamin E, vitamin K, calcium, magnesium, vitamin B5, vitamin B2, and iron. Rose hips cover your daily need for vitamin C, 450% more than soursop. Rose hips have a higher glycemic index (64) than soursop (32). Soursop, raw and Rose Hips, wild (Northern Plains Indians) types were used in this article.
Infographic
Mineral Comparison
Mineral comparison score is based on the number of minerals by which one or the other food is richer. The "coverage" charts below show how much of the daily needs can be covered by 300 grams of the food.
1
100 g
300 g
1 cup, pulp - 225g 1 fruit (7" x 5-1/4" dia) - 625g
Magnesium
Magnesium
Calcium
Calcium
Potassium
Potassium
Iron
Iron
Copper
Copper
Zinc
Zinc
Phosphorus
Phosphorus
Sodium
Sodium
Manganese
Manganese
Selenium
Selenium
15%
4.2%
25%
23%
29%
2.7%
12%
1.8%
0%
3.3%
9
100 g
300 g
1 cup - 127g
Magnesium
Magnesium
Calcium
Calcium
Potassium
Potassium
Iron
Iron
Copper
Copper
Zinc
Zinc
Phosphorus
Phosphorus
Sodium
Sodium
Manganese
Manganese
Selenium
Selenium
49%
51%
38%
40%
38%
6.8%
26%
0.52%
133%
0%
Vitamin Comparison
Vitamin comparison score is based on the number of vitamins by which one or the other food is richer. The "coverage" charts below show how much of the daily needs can be covered by 300 grams of the food.
2
100 g
300 g
1 cup, pulp - 225g 1 fruit (7" x 5-1/4" dia) - 625g
Vitamin C
Vit. C
Vitamin D
Vit. D
Vitamin A
Vit. A
Vitamin E
Vit. E
Vitamin B1
Vit. B1
Vitamin B2
Vit. B2
Vitamin B3
Vit. B3
Vitamin B5
Vit. B5
Vitamin B6
Vit. B6
Vitamin B12
Vit. B12
Vitamin K
Vit. K
Folate
Folate
69%
0%
0%
1.6%
18%
12%
17%
15%
14%
0%
1%
11%
8
100 g
300 g
1 cup - 127g
Vitamin C
Vit. C
Vitamin D
Vit. D
Vitamin A
Vit. A
Vitamin E
Vit. E
Vitamin B1
Vit. B1
Vitamin B2
Vit. B2
Vitamin B3
Vit. B3
Vitamin B5
Vit. B5
Vitamin B6
Vit. B6
Vitamin B12
Vit. B12
Vitamin K
Vit. K
Folate
Folate
1420%
0%
72%
117%
4%
38%
24%
48%
18%
0%
65%
2.3%
All nutrients comparison - raw data values
Nutrient
DV% diff.
Vitamin C
20.6mg
426mg
450%
Fiber
3.3g
24.1g
83%
Manganese
1.02mg
44%
Vitamin E
0.08mg
5.84mg
38%
Vitamin A
0µg
217µg
24%
Vitamin K
0.4µg
25.9µg
21%
Calcium
14mg
169mg
16%
Magnesium
21mg
69mg
11%
Vitamin B5
0.253mg
0.8mg
11%
Vitamin B2
0.05mg
0.166mg
9%
Carbs
16.84g
38.22g
7%
Iron
0.6mg
1.06mg
6%
Calories
66kcal
162kcal
5%
Phosphorus
27mg
61mg
5%
Vitamin B1
0.07mg
0.016mg
5%
Potassium
278mg
429mg
4%
Copper
0.086mg
0.113mg
3%
Vitamin B3
0.9mg
1.3mg
3%
Folate
14µg
3µg
3%
Protein
1g
1.6g
1%
Zinc
0.1mg
0.25mg
1%
Selenium
0.6µg
1%
Vitamin B6
0.059mg
0.076mg
1%
Choline
7.6mg
12mg
1%
Fructose
1.16g
1%
Protein per 100 calories
1.5g
0.99g
N/A
Calories per 10 g protein
660kcal
1013kcal
N/A
Weight per 100 calories
152g
62g
N/A
Fats
0.3g
0.34g
0%
Net carbs
13.54g
14.12g
N/A
Sugar
13.54g
2.58g
N/A
Sodium
14mg
4mg
0%
Saturated fat
0.051g
0%
Monounsaturated fat
0.09g
0%
Polyunsaturated fat
0.069g
0%
Tryptophan
0.011mg
0%
Lysine
0.06mg
0%
Methionine
0.007mg
0%
Macronutrient Comparison
Macronutrient breakdown side-by-side comparison
1
17%
81%
Protein:
1 g
Fats:
0.3 g
Carbs:
16.84 g
Water:
81.16 g
Other:
0.7 g
4
38%
59%
Protein:
1.6 g
Fats:
0.34 g
Carbs:
38.22 g
Water:
58.66 g
Other:
1.18 g
Contains
more
Water Water
+38.4%
Contains
more
Protein Protein
+60%
Contains
more
Fats Fats
+13.3%
Contains
more
Carbs Carbs
+127%
Contains
more
Other Other
+68.6%