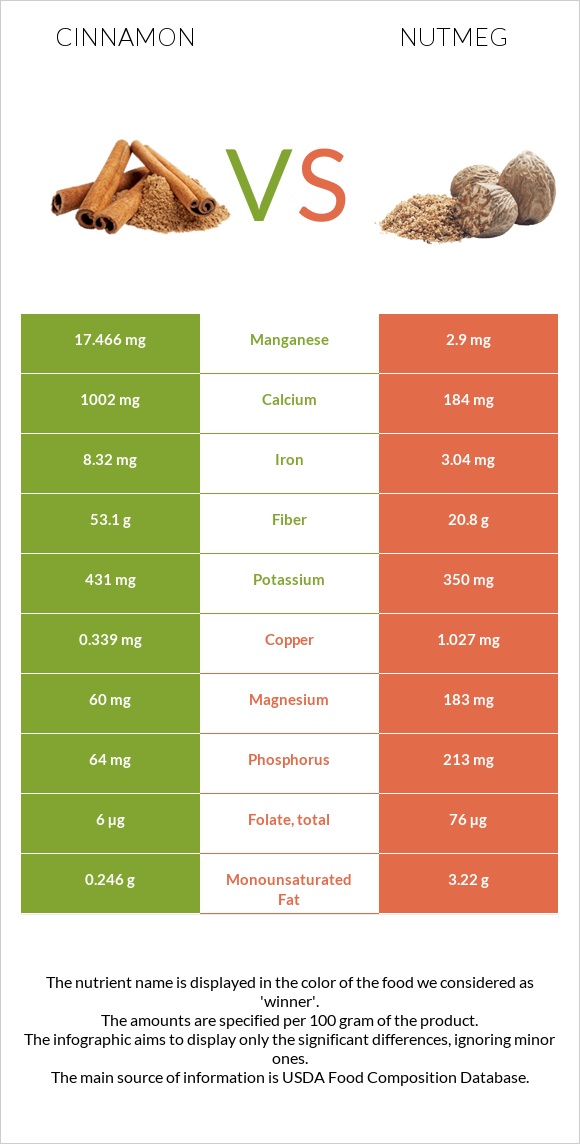
Foodstruct Nutrition Search | Diet Analysis | Food Comparison | Glycemic Index Chart | Insulin Index Chart | Blog | Subscribe | Sign Up

Cinnamon vs. Nutmeg — Health Impact and Nutrition Comparison

Article author photo Ani Harutyunyan by Ani Harutyunyan | Last updated on October 31, 2024
Medically reviewed by Jack Yacoubian Article author photo Jack  Yacoubian
Cinnamon
vs
Nutmeg

Summary

Nutmeg is richer in vitamin B1, magnesium, zinc, and phosphorus. Cinnamon is higher in vitamin A, calcium, and potassium. Cinnamon provides three times more vitamin C than Nutmeg. Cinnamon is lower in all types of fats

Introduction

In this article, we will compare Nutmeg (1) and Cinnamon (2), focusing on their nutritional content and health impact.

Actual differences

Cinnamon is the bark of a cinnamon tree from Sri Lanka, while Nutmeg is the fruit of Indonesian Myristica fragrans. Nutmeg has a subtle, pungent, and slightly spicy aroma. Cinnamon has a sweet, a bit spicy, and warm flavor. Nutmeg is commonly used in savory dishes, while cinnamon is usually in sweet dishes; in Middle Eastern cuisine, it is also used in savory dishes.

Nutritional content comparison

Since we use nutmeg and cinnamon as spices, most macronutrients and calories are not of big impact. 

Calories

Nutmeg is high in calories, while Cinnamon is a medium-calorie food. 

It is important to note that we do not consume nutmeg and cinnamon in high amounts, so they will not have an impact on our daily calorie intake. 

Nutmeg is almost two times higher in calories than Cinnamon.

Nutmeg provides 525 calories per 100g, and Cinnamon contains 247 calories per the same amount.

Minerals

Nutmeg is higher in magnesium, phosphorus, zinc, and copper. Nutmeg contains three times more magnesium than Cinnamon. Cinnamon is higher in calcium, iron, and potassium.

You can check the mineral comparison chart below.

Mineral Comparison

Mineral comparison score is based on the number of minerals by which one or the other food is richer. The "coverage" charts below show how much of the daily needs can be covered by 300 grams of the food.
Magnesium Magnesium Calcium Calcium Potassium Potassium Iron Iron Copper Copper Zinc Zinc Phosphorus Phosphorus Sodium Sodium Manganese Manganese Selenium Selenium 43% 301% 38% 312% 113% 50% 27% 1.3% 2278% 17%
Nutmeg
4
Magnesium Magnesium Calcium Calcium Potassium Potassium Iron Iron Copper Copper Zinc Zinc Phosphorus Phosphorus Sodium Sodium Manganese Manganese Selenium Selenium 131% 55% 31% 114% 342% 59% 91% 2.1% 378% 8.7%
Contains more CalciumCalcium +444.6%
Contains more PotassiumPotassium +23.1%
Contains more IronIron +173.7%
Contains less SodiumSodium -37.5%
Contains more ManganeseManganese +502.3%
Contains more SeleniumSelenium +93.8%
Contains more MagnesiumMagnesium +205%
Contains more CopperCopper +202.9%
Contains more ZincZinc +17.5%
Contains more PhosphorusPhosphorus +232.8%

Vitamins

Although Nutmeg and Cinnamon are packed with vitamins, Cinnamon is relatively richer in vitamins. Cinnamon is richer in vitamins A, C, E, and K. It is approximately three times higher in vitamin A than Nutmeg.

Nutmeg is higher in vitamins B1, B2, and folate.

Vitamin Comparison

Vitamin comparison score is based on the number of vitamins by which one or the other food is richer. The "coverage" charts below show how much of the daily needs can be covered by 300 grams of the food.
Vitamin C Vit. C Vitamin A Vit. A Vitamin E Vit. E Vitamin D Vit. D Vitamin B1 Vit. B1 Vitamin B2 Vit. B2 Vitamin B3 Vit. B3 Vitamin B5 Vit. B5 Vitamin B6 Vit. B6 Vitamin B12 Vit. B12 Vitamin K Vit. K Folate Folate Choline Choline 13% 5% 46% 0% 5.5% 9.5% 25% 21% 36% 0% 78% 4.5% 6%
Nutmeg
3
Vitamin C Vit. C Vitamin A Vit. A Vitamin E Vit. E Vitamin D Vit. D Vitamin B1 Vit. B1 Vitamin B2 Vit. B2 Vitamin B3 Vit. B3 Vitamin B5 Vit. B5 Vitamin B6 Vit. B6 Vitamin B12 Vit. B12 Vitamin K Vit. K Folate Folate Choline Choline 10% 1.7% 0% 0% 87% 13% 24% 0% 37% 0% 0% 57% 4.8%
Contains more Vitamin CVitamin C +26.7%
Contains more Vitamin AVitamin A +200%
Contains more Vitamin EVitamin E +∞%
Contains more Vitamin B5Vitamin B5 +∞%
Contains more Vitamin KVitamin K +∞%
Contains more CholineCholine +25%
Contains more Vitamin B1Vitamin B1 +1472.7%
Contains more Vitamin B2Vitamin B2 +39%
Contains more FolateFolate +1166.7%
~equal in Vitamin D ~0µg
~equal in Vitamin B3 ~1.299mg
~equal in Vitamin B6 ~0.16mg
~equal in Vitamin B12 ~0µg

Fats

Nutmeg is higher in fats than Cinnamon. It contains 36.3g of fats per 100g, while the same serving of Cinnamon provides 1.2g. However, no one eats 100g of nutmeg. 

Cinnamon is significantly lower in saturated fats. Nutmeg is also higher in mono/polyunsaturated fats.

Carbs

Cinnamon contains more carbs than Nutmeg. It has 80.6g of carbs per 100g, while Nutmeg has only 49.3g per 100g.

Fiber

Both Nutmeg and cinnamon are rich in fiber. However, Cinnamon is 32.3g higher in fiber than Nutmeg. Cinnamon is especially richer in insoluble fiber.

Health impact

Cardiovascular health

Section reviewed by cardiologist Astghik Grigoryan Article author photo Astghik Grigoryan

Cinnamon and nutmeg both help to reduce the risk of heart disease. 

Cinnamon has been demonstrated to lower LDL (“bad” cholesterol), the main cause of atherosclerosis, and assist in managing blood pressure (3,4).

Animal studies have shown that nutmeg can lower heart disease risk factors due to reducing total cholesterol levels in the blood. However, more research is required to corroborate these findings in humans (5).

Additionally, both include antioxidants that help counteract oxidative stress, a major risk factor for cardiovascular disease.

Anti-inflammatory effects

Inflammation is linked to several health conditions, such as diabetes, heart disease, and arthritis (6).

Cinnamon reduces inflammation by containing cinnamaldehyde (7).

Nutmeg contains anti-inflammatory chemicals called monoterpenes (8). However, more studies are needed to confirm the anti-inflammatory effects of Nutmeg in humans.

Blood sugar control

A study shows that high-dose nutmeg extract can reduce blood sugar levels and promote pancreatic function (9).

Cinnamon is famous for its anti-diabetic properties. It slows the digestion of carbohydrates in the intestine by inhibiting the enzymes responsible for that function (10) (11). Cinnamon contains a chemical called hydroxychalcone, which mimics insulin in our organism (11) (12). Cinnamon is linked with higher insulin sensitivity (13).

Article author photo Ani Harutyunyan
Education: General Medicine at YSMU
Last updated: October 31, 2024
Medically reviewed by Jack Yacoubian

Infographic

Cinnamon vs Nutmeg infographic
Infographic link

Macronutrient Comparison

Macronutrient breakdown side-by-side comparison
4% 81% 11% 4%
Protein: 3.99 g
Fats: 1.24 g
Carbs: 80.59 g
Water: 10.58 g
Other: 3.6 g
Nutmeg
2
6% 36% 49% 6% 2%
Protein: 5.84 g
Fats: 36.31 g
Carbs: 49.29 g
Water: 6.23 g
Other: 2.33 g
Contains more CarbsCarbs +63.5%
Contains more WaterWater +69.8%
Contains more OtherOther +54.5%
Contains more ProteinProtein +46.4%
Contains more FatsFats +2828.2%

Fat Type Comparison

Fat type breakdown side-by-side comparison
52% 37% 10%
Saturated fat: Sat. Fat 0.345 g
Monounsaturated fat: Mono. Fat 0.246 g
Polyunsaturated fat: Poly. Fat 0.068 g
Nutmeg
2
88% 11%
Saturated fat: Sat. Fat 25.94 g
Monounsaturated fat: Mono. Fat 3.22 g
Polyunsaturated fat: Poly. Fat 0.35 g
Contains less Sat. FatSaturated fat -98.7%
Contains more Mono. FatMonounsaturated fat +1208.9%
Contains more Poly. FatPolyunsaturated fat +414.7%

Comparison summary table

Pay attention to the rightmost column. It displays the amounts side by side, giving a clearer understanding of the difference.
Cinnamon Nutmeg
Lower in Glycemic Index ok
Lower in Sugar ok
Lower in Sodium ok
Lower in Saturated fat ok
Lower in price ok
Lower in Cholesterol Equal
Rich in minerals Equal
Rich in vitamins Equal

All nutrients comparison - raw data values

Nutrient Cinnamon Nutmeg DV% diff.
Manganese 17.466mg 2.9mg 633%
Fiber 53.1g 20.8g 129%
Saturated fat 0.345g 25.94g 116%
Calcium 1002mg 184mg 82%
Copper 0.339mg 1.027mg 76%
Iron 8.32mg 3.04mg 66%
Fats 1.24g 36.31g 54%
Magnesium 60mg 183mg 29%
Vitamin B1 0.022mg 0.346mg 27%
Vitamin K 31.2µg 0µg 26%
Phosphorus 64mg 213mg 21%
Folate 6µg 76µg 18%
Vitamin E 2.32mg 0mg 15%
Calories 247kcal 525kcal 14%
Carbs 80.59g 49.29g 10%
Monounsaturated fat 0.246g 3.22g 7%
Vitamin B5 0.358mg 7%
Protein 3.99g 5.84g 4%
Zinc 1.83mg 2.15mg 3%
Selenium 3.1µg 1.6µg 3%
Potassium 431mg 350mg 2%
Polyunsaturated fat 0.068g 0.35g 2%
Fructose 1.11g 1%
Vitamin B2 0.041mg 0.057mg 1%
Vitamin C 3.8mg 3mg 1%
Vitamin A 15µg 5µg 1%
Net carbs 27.49g 28.49g N/A
Sugar 2.17g 2.99g N/A
Sodium 10mg 16mg 0%
Vitamin B3 1.332mg 1.299mg 0%
Vitamin B6 0.158mg 0.16mg 0%
Choline 11mg 8.8mg 0%
Tryptophan 0.049mg 0%
Threonine 0.136mg 0%
Isoleucine 0.146mg 0%
Leucine 0.253mg 0%
Lysine 0.243mg 0%
Methionine 0.078mg 0%
Phenylalanine 0.146mg 0%
Valine 0.224mg 0%
Histidine 0.117mg 0%
Omega-3 - ALA 0.011g N/A

Which food is preferable for your diet?

ok
ok
is better in case of low diet
Cinnamon Nutmeg
Low Calories diet ok
Low Fats diet ok
Low Carbs diet ok
Low Glycemic Index diet ok

People also compare

Vitamins & Minerals Daily Need Coverage Score

The summary scores indicate the extent to which this food can fulfill your daily vitamin and mineral requirements if you consume 3 servings, consisting of 100 grams of each (an approximation of 3 serving sizes).
Vitamins Daily Need Coverage Score
19%
Cinnamon
18%
Nutmeg
Minerals Daily Need Coverage Score
318%
Cinnamon
121%
Nutmeg

Comparison summary

Which food is lower in glycemic index?
Nutmeg
Nutmeg is lower in glycemic index (difference - 0)
Which food is lower in Sugar?
Cinnamon
Cinnamon is lower in Sugar (difference - 0.82g)
Which food contains less Sodium?
Cinnamon
Cinnamon contains less Sodium (difference - 6mg)
Which food is lower in Saturated fat?
Cinnamon
Cinnamon is lower in Saturated fat (difference - 25.595g)
Which food is cheaper?
Cinnamon
Cinnamon is cheaper (difference - $2)
Which food contains less Cholesterol?
?
The foods are relatively equal in Cholesterol (0 mg)
Which food is richer in minerals?
?
It cannot be stated which food is richer in vitamins. See the charts below for detailed information. See the charts below for detailed information. See the charts below for detailed information.
Which food is richer in vitamins?
?
It cannot be stated which food is richer in vitamins. See the charts below for detailed information. See the charts below for detailed information. See the charts below for detailed information.

References

All the values for which the sources are not specified explicitly are taken from FDA’s Food Central. The exact link to the food presented on this page can be found below.

  1. Cinnamon - https://fdc.nal.usda.gov/fdc-app.html#/food-details/171320/nutrients
  2. Nutmeg - https://fdc.nal.usda.gov/fdc-app.html#/food-details/171326/nutrients

All the Daily Values are presented for males aged 31-50, for 2000-calorie diets.

Data provided by FoodStruct.com should be considered and used as information only. Please consult your physician before beginning any diet.