Steak vs. Whipped cream — In-Depth Nutrition Comparison
Compare
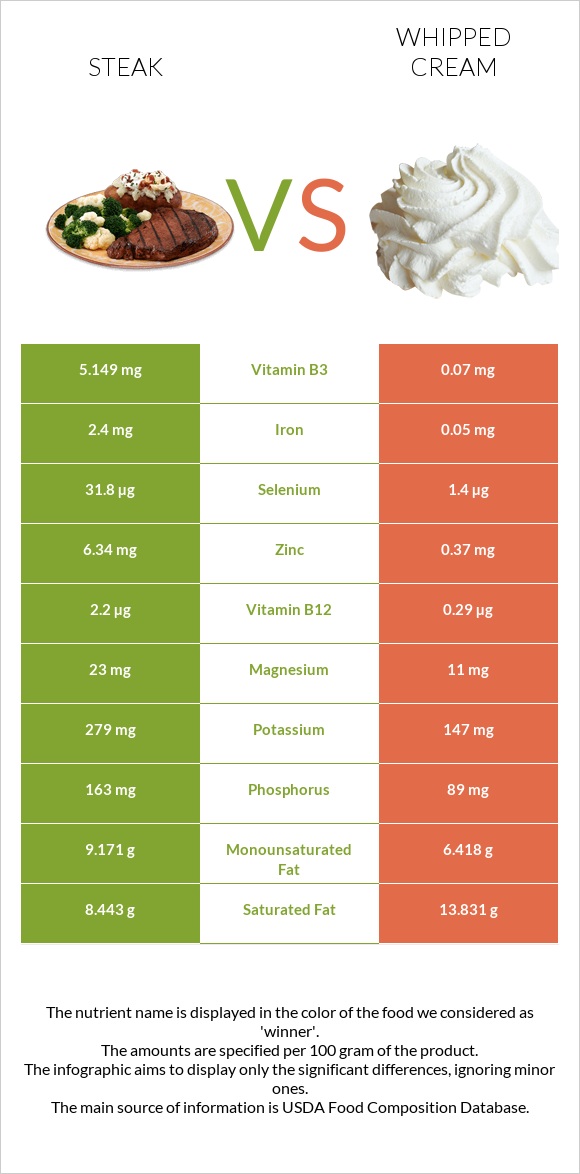
Differences between steak and whipped cream
- Steak has more vitamin B12, selenium, zinc, vitamin B6, vitamin B3, iron, vitamin B2, and phosphorus, while whipped cream has more vitamin A.
- Steak's daily need coverage for vitamin B12 is 80% higher.
- Whipped cream contains 74 times less vitamin B3 than steak. Steak contains 5.149mg of vitamin B3, while whipped cream contains 0.07mg.
- The amount of saturated fat in steak is lower.
- Steak has a lower glycemic index. The glycemic index of steak is 0, while the glycemic index of whipped cream is 55.
The food types used in this comparison are Beef, rib eye steak, boneless, lip off, separable lean, and fat, trimmed to 0" fat, all grades, cooked, grilled and Cream, whipped, cream topping, pressurized.
Infographic
Infographic link
Mineral Comparison
Mineral comparison score is based on the number of minerals by which one or the other food is richer. The "coverage" charts below show how much of the daily needs can be covered by 300 grams of the food.
| Contains more MagnesiumMagnesium | +109.1% |
| Contains more PotassiumPotassium | +89.8% |
| Contains more IronIron | +4700% |
| Contains more CopperCopper | +750% |
| Contains more ZincZinc | +1613.5% |
| Contains more PhosphorusPhosphorus | +83.1% |
| Contains more SeleniumSelenium | +2171.4% |
| Contains more CalciumCalcium | +741.7% |
| Contains less SodiumSodium | -86.2% |
Vitamin Comparison
Vitamin comparison score is based on the number of vitamins by which one or the other food is richer. The "coverage" charts below show how much of the daily needs can be covered by 300 grams of the food.
| Contains more Vitamin B1Vitamin B1 | +100% |
| Contains more Vitamin B2Vitamin B2 | +363.1% |
| Contains more Vitamin B3Vitamin B3 | +7255.7% |
| Contains more Vitamin B6Vitamin B6 | +1119.5% |
| Contains more Vitamin B12Vitamin B12 | +658.6% |
| Contains more FolateFolate | +100% |
| Contains more Vitamin AVitamin A | +2585.7% |
| Contains more Vitamin DVitamin D | +300% |
| Contains more Vitamin KVitamin K | +18.8% |
All nutrients comparison - raw data values
| Nutrient |  |
 |
DV% diff. |
| Vitamin B12 | 2.2µg | 0.29µg | 80% |
| Selenium | 31.8µg | 1.4µg | 55% |
| Zinc | 6.34mg | 0.37mg | 54% |
| Protein | 24.85g | 3.2g | 43% |
| Vitamin B6 | 0.5mg | 0.041mg | 35% |
| Vitamin B3 | 5.149mg | 0.07mg | 32% |
| Iron | 2.4mg | 0.05mg | 29% |
| Saturated fat | 8.443g | 13.831g | 24% |
| Vitamin A | 7µg | 188µg | 20% |
| Vitamin B2 | 0.301mg | 0.065mg | 18% |
| Phosphorus | 163mg | 89mg | 11% |
| Calcium | 12mg | 101mg | 9% |
| Copper | 0.085mg | 0.01mg | 8% |
| Monounsaturated fat | 9.171g | 6.418g | 7% |
| Vitamin B5 | 0.305mg | 6% | |
| Fats | 19.02g | 22.22g | 5% |
| Carbs | 0g | 12.49g | 4% |
| Potassium | 279mg | 147mg | 4% |
| Vitamin E | 0.64mg | 4% | |
| Magnesium | 23mg | 11mg | 3% |
| Vitamin B1 | 0.074mg | 0.037mg | 3% |
| Choline | 16.8mg | 3% | |
| Sodium | 58mg | 8mg | 2% |
| Vitamin D | 0.1µg | 0.4µg | 2% |
| Calories | 271kcal | 257kcal | 1% |
| Cholesterol | 78mg | 76mg | 1% |
| Vitamin D | 6 IU | 16 IU | 1% |
| Folate | 6µg | 3µg | 1% |
| Net carbs | 0g | 12.49g | N/A |
| Sugar | 0g | 8g | N/A |
| Manganese | 0.001mg | 0% | |
| Vitamin K | 1.6µg | 1.9µg | 0% |
| Polyunsaturated fat | 0.896g | 0.825g | 0% |
| Tryptophan | 0.278mg | 0.045mg | 0% |
| Threonine | 1.171mg | 0.144mg | 0% |
| Isoleucine | 1.157mg | 0.194mg | 0% |
| Leucine | 2.142mg | 0.313mg | 0% |
| Lysine | 2.38mg | 0.254mg | 0% |
| Methionine | 0.672mg | 0.08mg | 0% |
| Phenylalanine | 0.997mg | 0.154mg | 0% |
| Valine | 1.242mg | 0.214mg | 0% |
| Histidine | 0.931mg | 0.087mg | 0% |
| Omega-3 - EPA | 0.001g | 0g | N/A |
| Omega-3 - DHA | 0.001g | 0g | N/A |
| Omega-3 - DPA | 0.013g | 0g | N/A |
Macronutrient Comparison
Macronutrient breakdown side-by-side comparison
Protein:
24.85 g
Fats:
19.02 g
Carbs:
0 g
Water:
55.59 g
Other:
0.54 g
Protein:
3.2 g
Fats:
22.22 g
Carbs:
12.49 g
Water:
61.33 g
Other:
0.76 g
| Contains more ProteinProtein | +676.6% |
| Contains more FatsFats | +16.8% |
| Contains more CarbsCarbs | +∞% |
| Contains more WaterWater | +10.3% |
| Contains more OtherOther | +40.7% |
Fat Type Comparison
Fat type breakdown side-by-side comparison
Saturated fat:
Sat. Fat
8.443 g
Monounsaturated fat:
Mono. Fat
9.171 g
Polyunsaturated fat:
Poly. Fat
0.896 g
Saturated fat:
Sat. Fat
13.831 g
Monounsaturated fat:
Mono. Fat
6.418 g
Polyunsaturated fat:
Poly. Fat
0.825 g
| Contains less Sat. FatSaturated fat | -39% |
| Contains more Mono. FatMonounsaturated fat | +42.9% |
~equal in
Polyunsaturated fat
~0.825g


