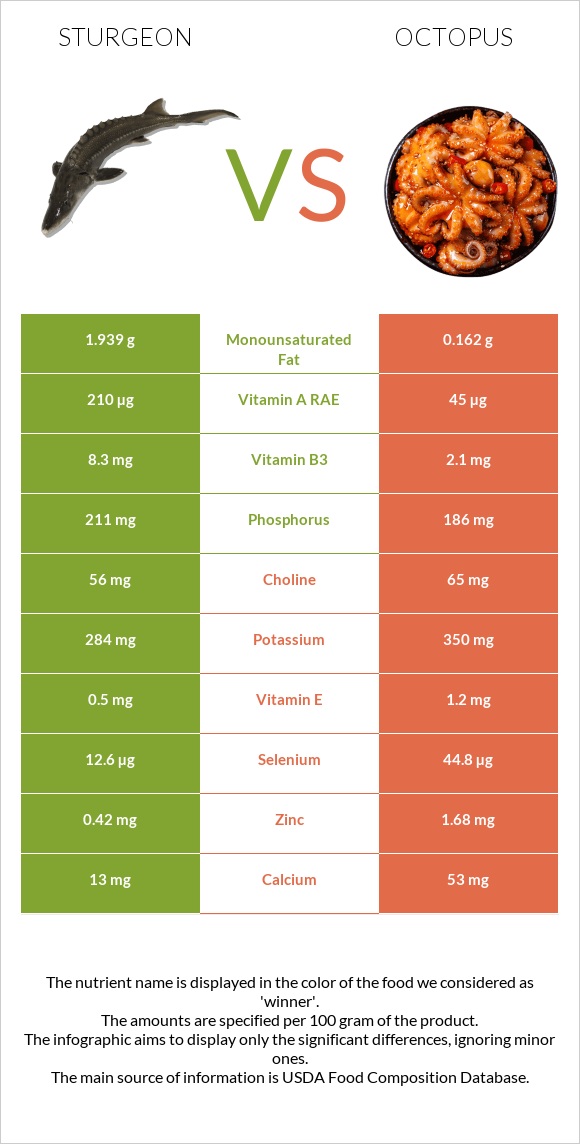
A recap on the differences between sturgeon and octopus Sturgeon has more vitamin D*, vitamin B3, and vitamin A; however, octopus is higher in vitamin B12, selenium, iron, copper, vitamin B6, and zinc. Octopus covers your daily vitamin B12 needs 1396% more than sturgeon. Sturgeon has less sodium. Food varieties used in this article are Fish, sturgeon, mixed species, cooked, dry heat and Mollusks, octopus, common, cooked, moist heat .
Infographic
Mineral Comparison
Mineral comparison score is based on the number of minerals by which one or the other food is richer. The "coverage" charts below show how much of the daily needs can be covered by 300 grams of the food.
1
100 g
300 g
1 cubic inch, boneless - 17g 1 oz, boneless - 28.35g 3 oz - 85g 1 cup, cooked - 136g 1 piece (4-1/2" x 2-1/8" x 7/8") - 145g
Magnesium
Magnesium
Calcium
Calcium
Potassium
Potassium
Iron
Iron
Copper
Copper
Zinc
Zinc
Phosphorus
Phosphorus
Sodium
Sodium
Manganese
Manganese
Selenium
Selenium
32%
5.1%
32%
34%
18%
15%
116%
9%
3.9%
88%
8
100 g
300 g
3 oz - 85g
Magnesium
Magnesium
Calcium
Calcium
Potassium
Potassium
Iron
Iron
Copper
Copper
Zinc
Zinc
Phosphorus
Phosphorus
Sodium
Sodium
Manganese
Manganese
Selenium
Selenium
43%
32%
56%
358%
246%
92%
120%
60%
6.1%
489%
Vitamin Comparison
Vitamin comparison score is based on the number of vitamins by which one or the other food is richer. The "coverage" charts below show how much of the daily needs can be covered by 300 grams of the food.
5
100 g
300 g
1 cubic inch, boneless - 17g 1 oz, boneless - 28.35g 3 oz - 85g 1 cup, cooked - 136g 1 piece (4-1/2" x 2-1/8" x 7/8") - 145g
Vitamin C
Vit. C
Vitamin D
Vit. D
Vitamin A
Vit. A
Vitamin E
Vit. E
Vitamin B1
Vit. B1
Vitamin B2
Vit. B2
Vitamin B3
Vit. B3
Vitamin B5
Vit. B5
Vitamin B6
Vit. B6
Vitamin B12
Vit. B12
Vitamin K
Vit. K
Folate
Folate
0%
194%
88%
13%
20%
21%
189%
52%
53%
313%
0.25%
13%
5
100 g
300 g
3 oz - 85g
Vitamin C
Vit. C
Vitamin D
Vit. D
Vitamin A
Vit. A
Vitamin E
Vit. E
Vitamin B1
Vit. B1
Vitamin B2
Vit. B2
Vitamin B3
Vit. B3
Vitamin B5
Vit. B5
Vitamin B6
Vit. B6
Vitamin B12
Vit. B12
Vitamin K
Vit. K
Folate
Folate
27%
0%
30%
24%
14%
18%
71%
54%
150%
4500%
0.25%
18%
All nutrients comparison - raw data values
Nutrient
DV% diff.
Vitamin B12
2.5µg
36µg
1396%
Selenium
16.2µg
89.6µg
133%
Iron
0.9mg
9.54mg
108%
Copper
0.053mg
0.739mg
76%
Vitamin D
12.9µg
0µg
65%
Vitamin D*
515 IU
0 IU
64%
Vitamin B3
10.1mg
3.78mg
40%
Vitamin B6
0.23mg
0.648mg
32%
Zinc
0.54mg
3.36mg
26%
Vitamin A
263µg
90µg
19%
Protein
20.7g
29.82g
18%
Sodium
69mg
460mg
17%
Vitamin C
0mg
8mg
9%
Calcium
17mg
106mg
9%
Potassium
364mg
630mg
8%
Cholesterol
77mg
96mg
6%
Fats
5.18g
2.08g
5%
Monounsaturated fat
2.486g
0.324g
5%
Magnesium
45mg
60mg
4%
Vitamin E
0.63mg
1.2mg
4%
Saturated fat
1.173g
0.453g
3%
Polyunsaturated fat
0.885g
0.477g
3%
Vitamin B1
0.08mg
0.057mg
2%
Folate
17µg
24µg
2%
Choline
70mg
81mg
2%
Calories
135kcal
164kcal
1%
Carbs
0g
4.4g
1%
Phosphorus
271mg
279mg
1%
Manganese
0.03mg
0.047mg
1%
Vitamin B2
0.09mg
0.076mg
1%
Vitamin B5
0.87mg
0.9mg
1%
Protein per 100 calories
15g
18g
N/A
Calories per 10 g protein
65kcal
55kcal
N/A
Weight per 100 calories
74g
61g
N/A
Unsaturated / Saturated Fat ratio
2.9
1.8
N/A
Net carbs
0g
4.4g
N/A
Vitamin K
0.1µg
0.1µg
0%
Tryptophan
0.232mg
0.334mg
0%
Threonine
0.907mg
1.283mg
0%
Isoleucine
0.954mg
1.298mg
0%
Leucine
1.682mg
2.099mg
0%
Lysine
1.901mg
2.228mg
0%
Methionine
0.613mg
0.673mg
0%
Phenylalanine
0.808mg
1.069mg
0%
Valine
1.066mg
1.303mg
0%
Histidine
0.609mg
0.573mg
0%
Omega-3 - EPA
0.249g
0.152g
N/A
Omega-3 - DHA
0.119g
0.162g
N/A
Omega-3 - DPA
0.058g
0.012g
N/A
Macronutrient Comparison
Macronutrient breakdown side-by-side comparison
3
21%
5%
70%
4%
Protein:
20.7 g
Fats:
5.18 g
Carbs:
0 g
Water:
69.94 g
Other:
4.18 g
2
30%
2%
4%
61%
3%
Protein:
29.82 g
Fats:
2.08 g
Carbs:
4.4 g
Water:
60.5 g
Other:
3.2 g
Contains
more
Fats Fats
+149%
Contains
more
Water Water
+15.6%
Contains
more
Other Other
+30.6%
Contains
more
Protein Protein
+44.1%
Contains
more
Carbs Carbs
+∞%
Fat Type Comparison
Fat type breakdown side-by-side comparison
2
26%
55%
19%
Saturated fat:
Sat. Fat
1.173 g
Monounsaturated fat:
Mono. Fat
2.486 g
Polyunsaturated fat:
Poly. Fat
0.885 g
1
36%
26%
38%
Saturated fat:
Sat. Fat
0.453 g
Monounsaturated fat:
Mono. Fat
0.324 g
Polyunsaturated fat:
Poly. Fat
0.477 g
Contains
more
Mono. Fat Monounsaturated fat
+667.3%
Contains
more
Poly. Fat Polyunsaturated fat
+85.5%
Contains
less
Sat. Fat Saturated fat
-61.4%