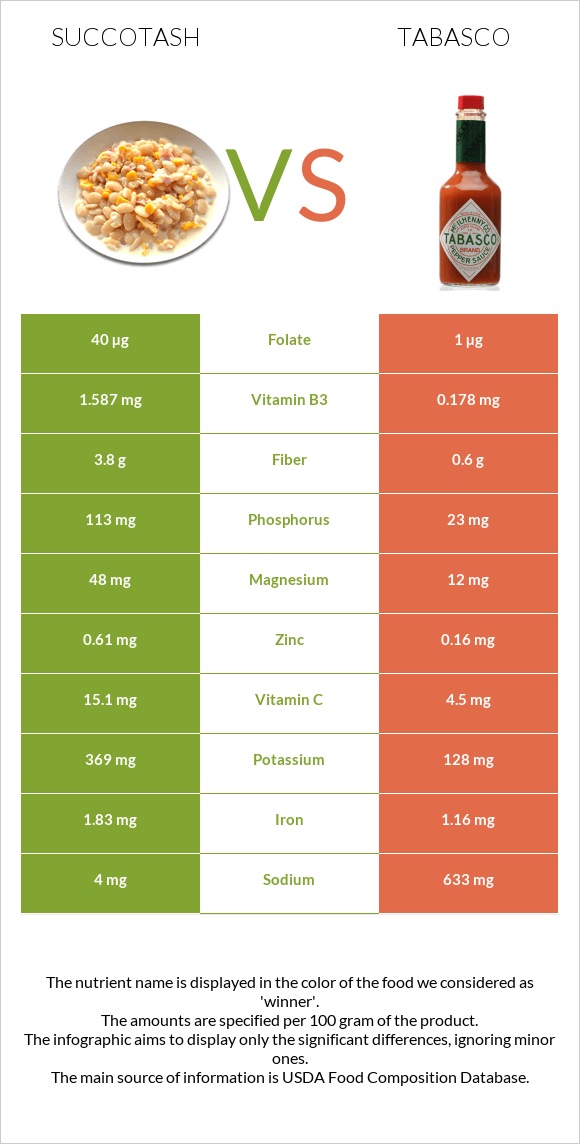
The main differences between succotash and tabasco Succotash is richer in manganese, vitamin B1, phosphorus, fiber, copper, vitamin C, folate, and vitamin B3, yet tabasco is richer in vitamin A. Daily need coverage for sodium for tabasco is 27% higher. Succotash contains 40 times more folate than tabasco. Succotash contains 40µg of folate, while tabasco contains 1µg. Succotash contains less sodium. Food types used in this article are Succotash, (corn and limas), raw and Sauce, ready-to-serve, pepper, TABASCO .
Infographic
Mineral Comparison
Mineral comparison score is based on the number of minerals by which one or the other food is richer. The "coverage" charts below show how much of the daily needs can be covered by 300 grams of the food.
10
100 g
300 g
Magnesium
Magnesium
Calcium
Calcium
Potassium
Potassium
Iron
Iron
Copper
Copper
Zinc
Zinc
Phosphorus
Phosphorus
Sodium
Sodium
Manganese
Manganese
Selenium
Selenium
34%
5.4%
33%
69%
62%
17%
48%
0.52%
90%
3.3%
0
100 g
300 g
0.25 tsp - 1.2g 1 tsp - 4.7g
Magnesium
Magnesium
Calcium
Calcium
Potassium
Potassium
Iron
Iron
Copper
Copper
Zinc
Zinc
Phosphorus
Phosphorus
Sodium
Sodium
Manganese
Manganese
Selenium
Selenium
8.6%
3.6%
11%
44%
25%
4.4%
9.9%
83%
14%
2.7%
Vitamin Comparison
Vitamin comparison score is based on the number of vitamins by which one or the other food is richer. The "coverage" charts below show how much of the daily needs can be covered by 300 grams of the food.
5
100 g
300 g
Vitamin C
Vit. C
Vitamin D
Vit. D
Vitamin A
Vit. A
Vitamin E
Vit. E
Vitamin B1
Vit. B1
Vitamin B2
Vit. B2
Vitamin B3
Vit. B3
Vitamin B5
Vit. B5
Vitamin B6
Vit. B6
Vitamin B12
Vit. B12
Vitamin K
Vit. K
Folate
Folate
50%
0%
5%
0%
52%
19%
30%
7.7%
30%
0%
0%
30%
4
100 g
300 g
0.25 tsp - 1.2g 1 tsp - 4.7g
Vitamin C
Vit. C
Vitamin D
Vit. D
Vitamin A
Vit. A
Vitamin E
Vit. E
Vitamin B1
Vit. B1
Vitamin B2
Vit. B2
Vitamin B3
Vit. B3
Vitamin B5
Vit. B5
Vitamin B6
Vit. B6
Vitamin B12
Vit. B12
Vitamin K
Vit. K
Folate
Folate
15%
0%
27%
0.2%
8%
19%
3.3%
6.6%
36%
0%
0.5%
0.75%
All nutrients comparison - raw data values
Nutrient
DV% diff.
Sodium
4mg
633mg
27%
Manganese
0.688mg
0.107mg
25%
Vitamin B1
0.208mg
0.032mg
15%
Fiber
3.8g
0.6g
13%
Phosphorus
113mg
23mg
13%
Vitamin C
15.1mg
4.5mg
12%
Copper
0.186mg
0.075mg
12%
Folate
40µg
1µg
10%
Magnesium
48mg
12mg
9%
Vitamin B3
1.587mg
0.178mg
9%
Iron
1.83mg
1.16mg
8%
Protein
5.03g
1.29g
7%
Potassium
369mg
128mg
7%
Vitamin A
15µg
82µg
7%
Carbs
19.59g
0.8g
6%
Calories
99kcal
12kcal
4%
Zinc
0.61mg
0.16mg
4%
Vitamin B6
0.13mg
0.154mg
2%
Calcium
18mg
12mg
1%
Polyunsaturated fat
0.489g
0.401g
1%
Protein per 100 calories
5.1g
11g
N/A
Calories per 10 g protein
197kcal
93kcal
N/A
Weight per 100 calories
101g
833g
N/A
Fats
1.02g
0.76g
0%
Net carbs
15.79g
0.2g
N/A
Sugar
0.13g
N/A
Vitamin E
0.01mg
0%
Selenium
0.6µg
0.5µg
0%
Vitamin B2
0.082mg
0.084mg
0%
Vitamin B5
0.128mg
0.11mg
0%
Vitamin K
0.2µg
0%
Saturated fat
0.19g
0.106g
0%
Monounsaturated fat
0.198g
0.061g
0%
Tryptophan
0.056mg
0.017mg
0%
Threonine
0.209mg
0.048mg
0%
Isoleucine
0.284mg
0.042mg
0%
Leucine
0.443mg
0.068mg
0%
Lysine
0.295mg
0.057mg
0%
Methionine
0.068mg
0.016mg
0%
Phenylalanine
0.243mg
0.04mg
0%
Valine
0.306mg
0.055mg
0%
Histidine
0.16mg
0.026mg
0%
Macronutrient Comparison
Macronutrient breakdown side-by-side comparison
3
5%
20%
73%
Protein:
5.03 g
Fats:
1.02 g
Carbs:
19.59 g
Water:
73.1 g
Other:
1.26 g
2
95%
2%
Protein:
1.29 g
Fats:
0.76 g
Carbs:
0.8 g
Water:
95.17 g
Other:
1.98 g
Contains
more
Protein Protein
+289.9%
Contains
more
Fats Fats
+34.2%
Contains
more
Carbs Carbs
+2348.8%
Contains
more
Water Water
+30.2%
Contains
more
Other Other
+57.1%
Fat Type Comparison
Fat type breakdown side-by-side comparison
2
22%
23%
56%
Saturated fat:
Sat. Fat
0.19 g
Monounsaturated fat:
Mono. Fat
0.198 g
Polyunsaturated fat:
Poly. Fat
0.489 g
1
19%
11%
71%
Saturated fat:
Sat. Fat
0.106 g
Monounsaturated fat:
Mono. Fat
0.061 g
Polyunsaturated fat:
Poly. Fat
0.401 g
Contains
more
Mono. Fat Monounsaturated fat
+224.6%
Contains
more
Poly. Fat Polyunsaturated fat
+21.9%
Contains
less
Sat. Fat Saturated fat
-44.2%