Sugar substitute vs. Custard — In-Depth Nutrition Comparison
Compare
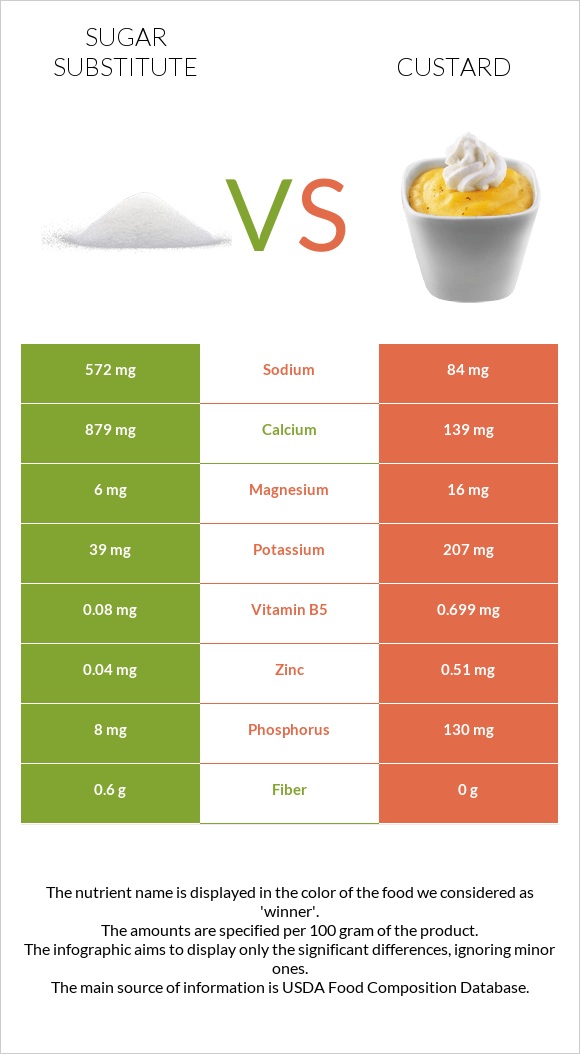
How are sugar substitute and custard different?
- Sugar substitute is higher in calcium; however, custard is richer in phosphorus, vitamin B2, and vitamin B5.
- Daily need coverage for calcium for sugar substitute is 74% higher.
- Custard has less sodium.
Sweeteners, sugar substitute, granulated, brown and Egg custards, dry mix, prepared with whole milk are the varieties used in this article.
Infographic
Infographic link
Mineral Comparison
Mineral comparison score is based on the number of minerals by which one or the other food is richer. The "coverage" charts below show how much of the daily needs can be covered by 300 grams of the food.
| Contains more CalciumCalcium | +532.4% |
| Contains more ManganeseManganese | +214.3% |
| Contains more MagnesiumMagnesium | +166.7% |
| Contains more PotassiumPotassium | +430.8% |
| Contains more IronIron | +112.5% |
| Contains more CopperCopper | +328.6% |
| Contains more ZincZinc | +1175% |
| Contains more PhosphorusPhosphorus | +1525% |
| Contains less SodiumSodium | -85.3% |
Vitamin Comparison
Vitamin comparison score is based on the number of vitamins by which one or the other food is richer. The "coverage" charts below show how much of the daily needs can be covered by 300 grams of the food.
| Contains more Vitamin B1Vitamin B1 | +306.7% |
| Contains more Vitamin B2Vitamin B2 | +1366.7% |
| Contains more Vitamin B5Vitamin B5 | +773.8% |
| Contains more Vitamin B6Vitamin B6 | +326.7% |
All nutrients comparison - raw data values
| Nutrient |  |
 |
DV% diff. |
| Calcium | 879mg | 139mg | 74% |
| Carbs | 84.77g | 17.6g | 22% |
| Vitamin B12 | 0.52µg | 22% | |
| Sodium | 572mg | 84mg | 21% |
| Cholesterol | 51mg | 17% | |
| Phosphorus | 8mg | 130mg | 17% |
| Vitamin B2 | 0.015mg | 0.22mg | 16% |
| Vitamin B5 | 0.08mg | 0.699mg | 12% |
| Calories | 347kcal | 122kcal | 11% |
| Selenium | 6µg | 11% | |
| Saturated fat | 2.032g | 9% | |
| Fats | 0g | 4g | 6% |
| Vitamin D | 47 IU | 6% | |
| Vitamin A | 52µg | 6% | |
| Vitamin D | 1.2µg | 6% | |
| Potassium | 39mg | 207mg | 5% |
| Protein | 2.06g | 3.99g | 4% |
| Zinc | 0.04mg | 0.51mg | 4% |
| Vitamin B1 | 0.015mg | 0.061mg | 4% |
| Vitamin B6 | 0.015mg | 0.064mg | 4% |
| Copper | 0.007mg | 0.03mg | 3% |
| Monounsaturated fat | 1.127g | 3% | |
| Magnesium | 6mg | 16mg | 2% |
| Iron | 0.16mg | 0.34mg | 2% |
| Fiber | 0.6g | 0g | 2% |
| Folate | 9µg | 2% | |
| Choline | 11.8mg | 2% | |
| Polyunsaturated fat | 0.312g | 2% | |
| Starch | 3.52g | 1% | |
| Manganese | 0.022mg | 0.007mg | 1% |
| Vitamin B3 | 0.132mg | 1% | |
| Vitamin C | 0.1mg | 0% | |
| Net carbs | 84.17g | 17.6g | N/A |
| Sugar | 4.03g | 4.82g | N/A |
| Vitamin E | 0.06mg | 0% | |
| Vitamin K | 0.2µg | 0% | |
| Tryptophan | 0.082mg | 0% | |
| Threonine | 0.192mg | 0% | |
| Isoleucine | 0.207mg | 0% | |
| Leucine | 0.337mg | 0% | |
| Lysine | 0.214mg | 0% | |
| Methionine | 0.091mg | 0% | |
| Phenylalanine | 0.173mg | 0% | |
| Valine | 0.233mg | 0% | |
| Histidine | 0.092mg | 0% | |
| Omega-3 - DHA | 0.003g | N/A |
Macronutrient Comparison
Macronutrient breakdown side-by-side comparison
Protein:
2.06 g
Fats:
0 g
Carbs:
84.77 g
Water:
9.14 g
Other:
4.03 g
Protein:
3.99 g
Fats:
4 g
Carbs:
17.6 g
Water:
73.45 g
Other:
0.96 g
| Contains more CarbsCarbs | +381.6% |
| Contains more OtherOther | +319.8% |
| Contains more ProteinProtein | +93.7% |
| Contains more FatsFats | +∞% |
| Contains more WaterWater | +703.6% |
Carbohydrate type comparison
Carbohydrate type breakdown side-by-side comparison
Starch:
3.52 g
Sucrose:
0 g
Glucose:
1.09 g
Fructose:
0 g
Lactose:
0 g
Maltose:
2.94 g
Galactose:
0 g
Starch:
0 g
Sucrose:
0 g
Glucose:
0 g
Fructose:
0 g
Lactose:
4.63 g
Maltose:
0 g
Galactose:
0 g
| Contains more StarchStarch | +∞% |
| Contains more GlucoseGlucose | +∞% |
| Contains more MaltoseMaltose | +∞% |
| Contains more LactoseLactose | +∞% |
~equal in
Sucrose
~0g
~equal in
Fructose
~0g
~equal in
Galactose
~0g


