Taco vs. Fajita – Nutrition and Health Impact Comparison


Summary
Tacos are 9 times higher in carbohydrates, including dietary fiber, and 2 times higher in calories, fats, and protein. Fajitas contain 4 times more cholesterol.
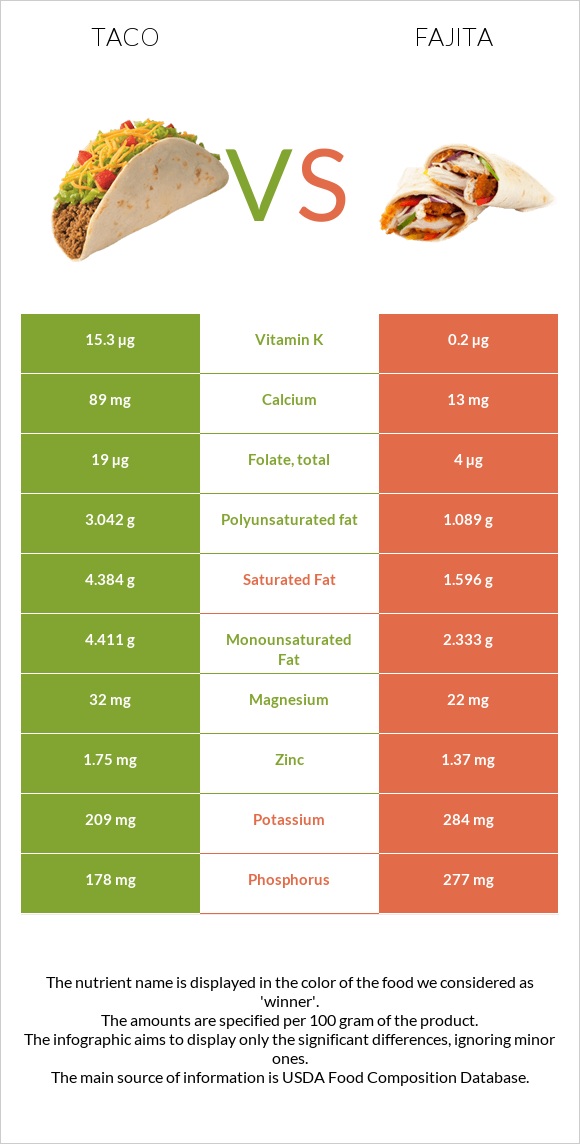
Taco has more vitamin B12, vitamin K, folate, vitamin C, vitamin E, calcium, and copper. Taco also is 2 times lower in sodium. On the other hand, fajita has more vitamin B6, vitamin B3, phosphorus, and selenium.
Introduction
Fajitas and tacos are popular Mexican dishes that are now considered fast food. We’ll discuss their differences and similarities, focusing on nutrition and health impact.
What’s The Actual Difference?
Tacos and fajitas have a lot in common. They have almost similar seasonings and have tortillas as an important ingredient. However, the main difference between fajitas and tacos is that tacos often have fresh lettuce, tomatoes, and other raw vegetables on top, while fajita ingredients are almost always grilled, including veggies.
A taco is a traditional Mexican dish consisting of a tortilla (usually corn or flour) filled with various ingredients. Fajitas is a Tex-Mex dish that originated in Texas but has Mexican influences but originated in Texas.
Tacos are filled tortillas that can contain a variety of ingredients, while fajitas consist of grilled meat with onions and peppers, typically served with tortillas and other accompaniments. The tortilla is usually soft and can be either steamed or lightly grilled.
Nutrition
At the bottom of this page, you can find a nutrition infographic to help you better understand the differences in the nutrition of fajitas and tacos.
For a fair comparison, we have chosen to provide nutritional infographics for 100g servings of taco and fajita. However, one average taco weighs around 69g, while one strip of fajita is equal to around 9.4g.
Macronutrient Comparison
Contains
more
FatsFats
+121.6%
Contains
more
CarbsCarbs
+790.1%
Contains
more
ProteinProtein
+109.5%
Contains
more
WaterWater
+23.8%
Contains
more
OtherOther
+83.4%
Calories
Tacos have nearly 2 times more calories than fajitas. Fajitas have 135 calories per 100g, while tacos have 206 calories per 100g.
Both can be considered medium-to-high-calorie foods.
Carbs
Tacos are significantly higher in carbohydrates, providing 9 times more per 100g serving. In this serving size, tacos contain 19.85g of carbs, while fajitas have 2.23g.
This difference is partially due to the taco's dietary fiber content. Tacos are a great source of fiber, falling in the top 22% of foods as a source, while fajitas lack this nutrient.
Fats
Tacos have over 2 times more fat than fajitas. It has 12.7g of fats per 100 g, whereas a fajita has only 5.73 g per 100 g.
Taco contains 4․4g of saturated and monounsaturated fats and 3g of polyunsaturated fats. Fajita, on the other hand, provides 1.6g of saturated, 2g of monounsaturated, and 1g of polyunsaturated fats.
Fat Type Comparison
Contains
more
Mono. FatMonounsaturated fat
+89.1%
Contains
more
Poly. FatPolyunsaturated fat
+179.3%
Contains
less
Sat. FatSaturated fat
-63.6%
Cholesterol
Despite the lower fat content, fajitas are 4 times higher in cholesterol, providing 88mg per 100g, whereas tacos have 28mg.
Protein
Fajitas provide considerably more protein, containing about 10g more per 100g. Overall, fajitas and tacos are good sources of protein, providing 18.6g and 8.9g, respectively, per 100g serving.
Naturally, fajitas are richer in all of the essential amino acids.
Minerals
The mineral content of tacos is higher than that of fajitas.
Taco contains almost 7 times more calcium, 4 times more manganese, and 3 times more copper than fajitas. Iron, magnesium, and zinc levels are also higher in tacos.
On the other hand, fajita has more selenium, potassium, and phosphorus than taco. The amount of sodium is lower in tacos.
Mineral Comparison
Contains
more
MagnesiumMagnesium
+45.5%
Contains
more
CalciumCalcium
+584.6%
Contains
more
IronIron
+20.2%
Contains
more
CopperCopper
+156.7%
Contains
more
ZincZinc
+27.7%
Contains
less
SodiumSodium
-50.3%
Contains
more
ManganeseManganese
+277.3%
Contains
more
PotassiumPotassium
+35.9%
Contains
more
PhosphorusPhosphorus
+55.6%
Contains
more
SeleniumSelenium
+81.5%
Vitamins
Tacos provide 5 times more folate, 3 times more vitamin E, and 76 times more vitamin K than fajitas.
The amounts of vitamin A, vitamin C, and vitamin B12 are also higher in tacos.
On the other hand, fajita contains 4 times more vitamin B6 and vitamin B2, also more vitamin B1 and vitamin B3 than tacos.
Vitamin Comparison
Contains
more
Vitamin CVitamin C
+∞%
Contains
more
Vitamin DVitamin D
+∞%
Contains
more
Vitamin AVitamin A
+∞%
Contains
more
Vitamin EVitamin E
+172.7%
Contains
more
Vitamin B12Vitamin B12
+72.2%
Contains
more
Vitamin KVitamin K
+7550%
Contains
more
FolateFolate
+375%
Contains
more
Vitamin B1Vitamin B1
+100%
Contains
more
Vitamin B2Vitamin B2
+255%
Contains
more
Vitamin B3Vitamin B3
+189.6%
Contains
more
Vitamin B6Vitamin B6
+330%
Acidity
Based on the PRAL values, the acidity of a fajita is about 12.6 (acidic), while that of a taco is 4.5 (acidic). This makes fajitas more acid-forming than tacos.
Health Impact
Diabetes
Overall, the health impact of these dishes depends on their ingredients and cooking methods. Since these are not constant, it’s hard to talk about a specific health impact caused by tacos or fajitas.
That being said, it has been researched that cooking meat at high temperatures, such as grilling and barbecuing, increases the risk of type 2 diabetes compared to cooking at moderate temperatures, such as boiling, steaming, and stir-frying (1). The components that make up fajitas are usually cooked at higher temperatures.
Cardiovascular Health
When comparing tacos and fajitas in terms of their impact on cardiovascular health, several factors come into play:
Saturated Fat and Cholesterol: both tacos and fajitas can be sources of saturated fats, depending on the choice of meat and additional toppings. Excessive intake of saturated fats can contribute to elevated cholesterol levels and increase the risk of atherosclerosis (3).
Sodium Content: the combination of processed meats and cheese in tacos, along with the use of seasonings in fajitas, can result in high sodium levels. It's important to note that excessive sodium intake has been associated with high blood pressure, which is a risk factor for cardiovascular diseases (4).
The Dietary Guidelines for Americans suggest that adults limit their sodium intake to less than 2,300 mg per day, which is about 1 teaspoon of table salt. The recommended limits for kids under 14 are even lower (5).
Preparation Method: tacos can be fried, which increases their calorie and fat content, whereas fajitas are typically grilled, which reduces added fat.
Portion Size and Frequency: portion control is crucial with both tacos and fajitas to avoid overconsumption of calories, fats, and sodium. Eating them in moderation and balancing them with other nutritious foods is important for overall cardiovascular health.
Conclusion: In terms of atherosclerosis and cardiovascular health, both tacos and fajitas can be part of a balanced diet if prepared with fresh, lean ingredients and in moderation. Choosing grilled over fried options, minimizing cheese and sour cream, and paying attention to portion sizes are key factors in making them healthier choices. Additionally, incorporating plenty of vegetables and opting for whole-grain tortillas when possible can further enhance their nutritional value.
Red Meat Allergy
People with red meat allergies are usually sensitive to cat serum albumin, which reacts with pork albumin. Common symptoms include urticaria, vomiting, and stomach cramps, with anaphylaxis occurring in rare cases (6). Specific IgE antibodies to galactose-1,3-galactose (-Gal), an oligosaccharide found in non-primate mammals, are frequently associated with these cases.
References
- https://www.hsph.harvard.edu/nutritionsource/2018/03/23/how-meat-is-cooked-may-affect-risk-of-type-2-diabetes/
- https://www.sciencedirect.com/science/article/abs/pii/S0033062006000831
- https://www.escardio.org/The-ESC/Press-Office/Press-releases/Are-all-saturated-fats-equally-bad-for-the-heart
- https://www.heart.org/en/health-topics/high-blood-pressure/changes-you-can-make-to-manage-high-blood-pressure/shaking-the-salt-habit-to-lower-high-blood-pressure
- https://www.fda.gov/food/nutrition-education-resources-materials/sodium-your-diet
- www.ncbi.nlm.nih.gov/pmc/articles/PMC6488443

Infographic
All nutrients comparison - raw data values
| Nutrient | |
|
DV% diff. |
| Vitamin B6 | 0.09mg | 0.387mg | 23% |
| Cholesterol | 28mg | 88mg | 20% |
| Vitamin B3 | 1.65mg | 4.779mg | 20% |
| Protein | 8.86g | 18.56g | 19% |
| Sodium | 397mg | 799mg | 17% |
| Fiber | 3.9g | 0g | 16% |
| Vitamin B12 | 0.93µg | 0.54µg | 16% |
| Vitamin B5 | 0.726mg | 15% | |
| Phosphorus | 178mg | 277mg | 14% |
| Selenium | 9.2µg | 16.7µg | 14% |
| Vitamin K | 15.3µg | 0.2µg | 13% |
| Saturated fat | 4.384g | 1.596g | 13% |
| Polyunsaturated fat | 3.042g | 1.089g | 13% |
| Vitamin B2 | 0.06mg | 0.213mg | 12% |
| Fats | 12.7g | 5.73g | 11% |
| Calcium | 89mg | 13mg | 8% |
| Manganese | 0.249mg | 0.066mg | 8% |
| Choline | 32mg | 67.8mg | 7% |
| Carbs | 19.85g | 2.23g | 6% |
| Starch | 14.78g | 6% | |
| Calories | 226kcal | 135kcal | 5% |
| Copper | 0.077mg | 0.03mg | 5% |
| Monounsaturated fat | 4.411g | 2.333g | 5% |
| Vitamin B1 | 0.05mg | 0.1mg | 4% |
| Folate | 19µg | 4µg | 4% |
| Iron | 1.19mg | 0.99mg | 3% |
| Zinc | 1.75mg | 1.37mg | 3% |
| Vitamin E | 0.6mg | 0.22mg | 3% |
| Magnesium | 32mg | 22mg | 2% |
| Potassium | 209mg | 284mg | 2% |
| Vitamin A | 20µg | 0µg | 2% |
| Vitamin D* | 4 IU | 1% | |
| Vitamin D | 0.1µg | 1% | |
| Protein per 100 calories | 3.9g | 14g | N/A |
| Calories per 10 g protein | 255kcal | 73kcal | N/A |
| Weight per 100 calories | 44g | 74g | N/A |
| Unsaturated / Saturated Fat ratio | 1.7 | 2.1 | N/A |
| Vitamin C | 0.4mg | 0mg | 0% |
| Net carbs | 15.95g | 2.23g | N/A |
| Sugar | 0.9g | 0g | N/A |
| Trans fat | 0.467g | N/A | |
| Tryptophan | 0.2mg | 0% | |
| Threonine | 0.452mg | 0% | |
| Isoleucine | 0.813mg | 0% | |
| Leucine | 1.56mg | 0% | |
| Lysine | 1.857mg | 0% | |
| Methionine | 0.552mg | 0% | |
| Phenylalanine | 0.763mg | 0% | |
| Valine | 0.847mg | 0% | |
| Histidine | 0.68mg | 0% | |
| Fructose | 0.3g | 0% | |
| Omega-3 - EPA | 0.005g | 0g | N/A |
| Omega-3 - ALA | 0.166g | N/A | |
| Omega-3 - DPA | 0.006g | 0.007g | N/A |
| Omega-3 - Eicosatrienoic acid | 0.001g | N/A | |
| Omega-6 - Gamma-linoleic acid | 0.002g | N/A | |
| Omega-6 - Dihomo-gamma-linoleic acid | 0.011g | N/A | |
| Omega-6 - Eicosadienoic acid | 0.004g | 0.01g | N/A |
| Omega-6 - Linoleic acid | 2.708g | N/A |
People also compare


References
All the values for which the sources are not specified explicitly are taken from FDA’s Food Central. The exact link to the food presented on this page can be found below.
All the Daily Values are presented for males aged 31-50, for 2000-calorie diets.