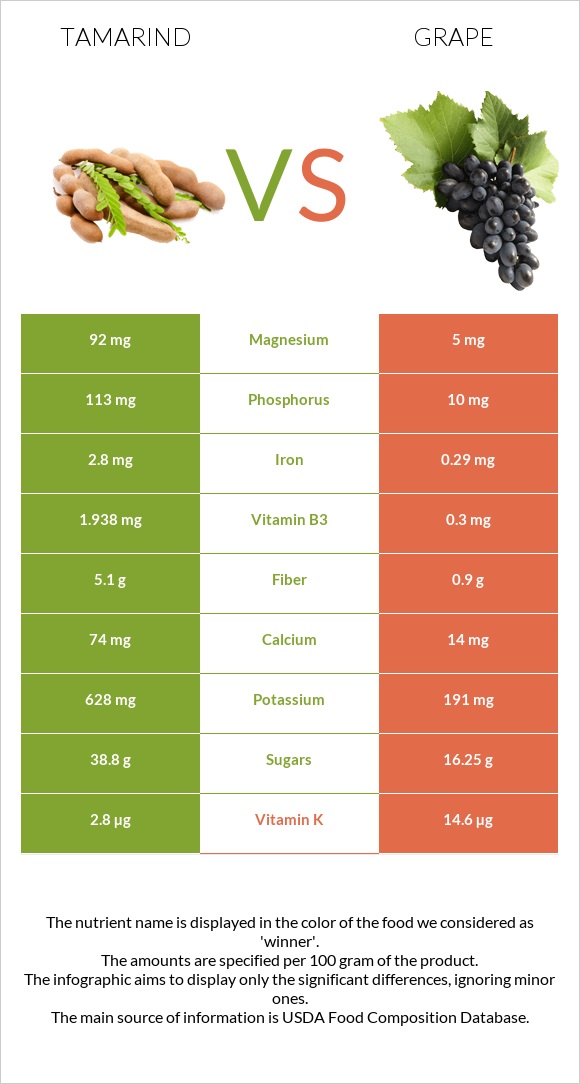
Summary of differences between tamarind and grapes Tamarind has more iron, vitamin B1, magnesium, fiber, phosphorus, potassium, vitamin B3, vitamin B2, and calcium, while grapes have more vitamin K. Tamarind covers your daily need for iron, 31% more than grapes. Tamarind contains 18 times more magnesium than grapes. While tamarind contains 92mg of magnesium, grapes contain only 5mg. Tamarind has a lower glycemic index. The glycemic index of tamarind is 23, while the glycemic index of grapes is 49. These are the specific foods used in this comparison Tamarinds, raw and Grapes, american type (slip skin), raw .
Infographic
Mineral Comparison
Mineral comparison score is based on the number of minerals by which one or the other food is richer. The "coverage" charts below show how much of the daily needs can be covered by 300 grams of the food.
8
100 g
300 g
1 fruit (3" x 1") - 2g 1 cup, pulp - 120g
Magnesium
Magnesium
Calcium
Calcium
Potassium
Potassium
Iron
Iron
Copper
Copper
Zinc
Zinc
Phosphorus
Phosphorus
Sodium
Sodium
Manganese
Manganese
Selenium
Selenium
66%
22%
55%
105%
29%
2.7%
48%
3.7%
0%
7.1%
2
100 g
300 g
1 grape - 2.4g 1 cup - 92g
Magnesium
Magnesium
Calcium
Calcium
Potassium
Potassium
Iron
Iron
Copper
Copper
Zinc
Zinc
Phosphorus
Phosphorus
Sodium
Sodium
Manganese
Manganese
Selenium
Selenium
3.6%
4.2%
17%
11%
13%
1.1%
4.3%
0.26%
94%
0.55%
Vitamin Comparison
Vitamin comparison score is based on the number of vitamins by which one or the other food is richer. The "coverage" charts below show how much of the daily needs can be covered by 300 grams of the food.
5
100 g
300 g
1 fruit (3" x 1") - 2g 1 cup, pulp - 120g
Vitamin C
Vit. C
Vitamin D
Vit. D
Vitamin A
Vit. A
Vitamin E
Vit. E
Vitamin B1
Vit. B1
Vitamin B2
Vit. B2
Vitamin B3
Vit. B3
Vitamin B5
Vit. B5
Vitamin B6
Vit. B6
Vitamin B12
Vit. B12
Vitamin K
Vit. K
Folate
Folate
12%
0%
0.67%
2%
107%
35%
36%
8.6%
15%
0%
7%
11%
5
100 g
300 g
1 grape - 2.4g 1 cup - 92g
Vitamin C
Vit. C
Vitamin D
Vit. D
Vitamin A
Vit. A
Vitamin E
Vit. E
Vitamin B1
Vit. B1
Vitamin B2
Vit. B2
Vitamin B3
Vit. B3
Vitamin B5
Vit. B5
Vitamin B6
Vit. B6
Vitamin B12
Vit. B12
Vitamin K
Vit. K
Folate
Folate
13%
0%
1.7%
3.8%
23%
13%
5.6%
1.4%
25%
0%
37%
3%
All nutrients comparison - raw data values
Nutrient
DV% diff.
Iron
2.8mg
0.29mg
31%
Manganese
0.718mg
31%
Vitamin B1
0.428mg
0.092mg
28%
Magnesium
92mg
5mg
21%
Fiber
5.1g
0.9g
17%
Carbs
62.5g
17.15g
15%
Phosphorus
113mg
10mg
15%
Potassium
628mg
191mg
13%
Vitamin B3
1.938mg
0.3mg
10%
Vitamin K
2.8µg
14.6µg
10%
Calories
239kcal
67kcal
9%
Vitamin B2
0.152mg
0.057mg
7%
Calcium
74mg
14mg
6%
Copper
0.086mg
0.04mg
5%
Protein
2.8g
0.63g
4%
Vitamin B6
0.066mg
0.11mg
3%
Folate
14µg
4µg
3%
Selenium
1.3µg
0.1µg
2%
Vitamin B5
0.143mg
0.024mg
2%
Vitamin C
3.5mg
4mg
1%
Zinc
0.1mg
0.04mg
1%
Sodium
28mg
2mg
1%
Vitamin E
0.1mg
0.19mg
1%
Choline
8.6mg
5.6mg
1%
Saturated fat
0.272g
0.114g
1%
Protein per 100 calories
1.2g
0.94g
N/A
Calories per 10 g protein
854kcal
1063kcal
N/A
Weight per 100 calories
42g
149g
N/A
Fats
0.6g
0.35g
0%
Net carbs
57.4g
16.25g
N/A
Sugar
38.8g
16.25g
N/A
Vitamin A
2µg
5µg
0%
Monounsaturated fat
0.181g
0.014g
0%
Polyunsaturated fat
0.059g
0.102g
0%
Tryptophan
0.018mg
0.003mg
0%
Threonine
0.017mg
0%
Isoleucine
0.005mg
0%
Leucine
0.013mg
0%
Lysine
0.139mg
0.014mg
0%
Methionine
0.014mg
0.021mg
0%
Phenylalanine
0.013mg
0%
Valine
0.017mg
0%
Histidine
0.023mg
0%
Macronutrient Comparison
Macronutrient breakdown side-by-side comparison
4
3%
63%
31%
3%
Protein:
2.8 g
Fats:
0.6 g
Carbs:
62.5 g
Water:
31.4 g
Other:
2.7 g
1
17%
81%
Protein:
0.63 g
Fats:
0.35 g
Carbs:
17.15 g
Water:
81.3 g
Other:
0.57 g
Contains
more
Protein Protein
+344.4%
Contains
more
Fats Fats
+71.4%
Contains
more
Carbs Carbs
+264.4%
Contains
more
Other Other
+373.7%
Contains
more
Water Water
+158.9%
Fat Type Comparison
Fat type breakdown side-by-side comparison
1
53%
35%
12%
Saturated fat:
Sat. Fat
0.272 g
Monounsaturated fat:
Mono. Fat
0.181 g
Polyunsaturated fat:
Poly. Fat
0.059 g
2
50%
6%
44%
Saturated fat:
Sat. Fat
0.114 g
Monounsaturated fat:
Mono. Fat
0.014 g
Polyunsaturated fat:
Poly. Fat
0.102 g
Contains
more
Mono. Fat Monounsaturated fat
+1192.9%
Contains
less
Sat. Fat Saturated fat
-58.1%
Contains
more
Poly. Fat Polyunsaturated fat
+72.9%