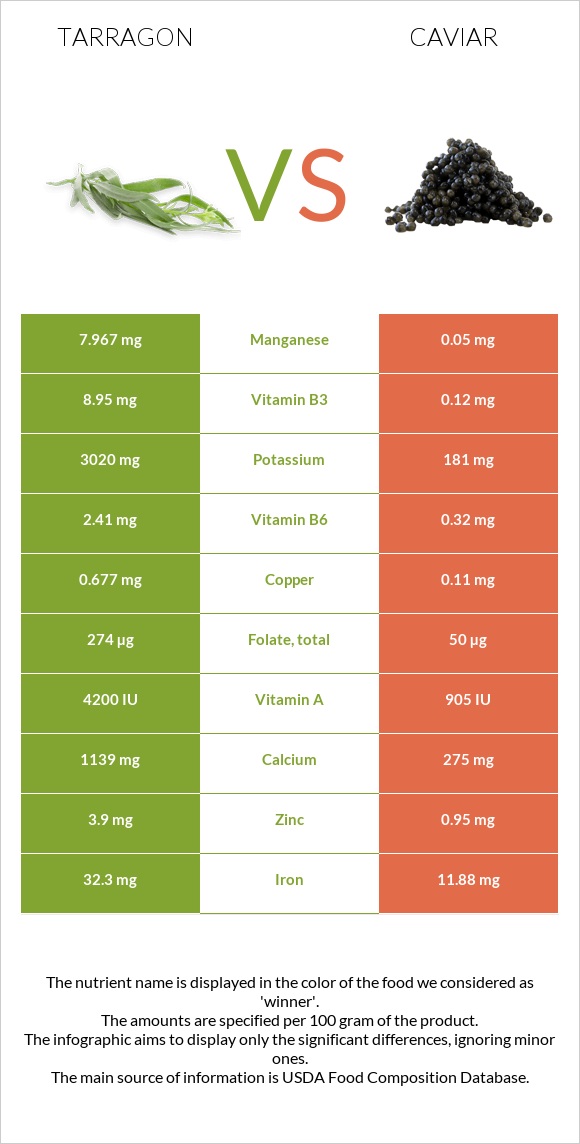
Summary of differences between tarragon and caviar Tarragon has more manganese, iron, vitamin B6, calcium, potassium, vitamin A, and copper, while caviar has more vitamin B12 and selenium. Caviar covers your daily need for vitamin B12, 833% more than tarragon. Tarragon contains 159 times more manganese than caviar. While tarragon contains 7.967mg of manganese, caviar contains only 0.05mg. These are the specific foods used in this comparison Spices, tarragon, dried and Fish, caviar, black, and red, granular .
Infographic
Mineral Comparison
Mineral comparison score is based on the number of minerals by which one or the other food is richer. The "coverage" charts below show how much of the daily needs can be covered by 300 grams of the food.
8
100 g
300 g
0.25 tsp - 0.5g 1 tsp, ground - 1.6g 1 tbsp, leaves - 1.8g 1 tbsp, ground - 4.8g
Magnesium
Magnesium
Calcium
Calcium
Potassium
Potassium
Iron
Iron
Copper
Copper
Zinc
Zinc
Phosphorus
Phosphorus
Sodium
Sodium
Manganese
Manganese
Selenium
Selenium
248%
342%
266%
1211%
226%
106%
134%
8.1%
1039%
24%
2
100 g
300 g
1 tbsp - 16g 1 oz - 28.35g
Magnesium
Magnesium
Calcium
Calcium
Potassium
Potassium
Iron
Iron
Copper
Copper
Zinc
Zinc
Phosphorus
Phosphorus
Sodium
Sodium
Manganese
Manganese
Selenium
Selenium
214%
83%
16%
446%
37%
26%
153%
196%
6.5%
357%
Vitamin Comparison
Vitamin comparison score is based on the number of vitamins by which one or the other food is richer. The "coverage" charts below show how much of the daily needs can be covered by 300 grams of the food.
6
100 g
300 g
0.25 tsp - 0.5g 1 tsp, ground - 1.6g 1 tbsp, leaves - 1.8g 1 tbsp, ground - 4.8g
Vitamin C
Vit. C
Vitamin D
Vit. D
Vitamin A
Vit. A
Vitamin E
Vit. E
Vitamin B1
Vit. B1
Vitamin B2
Vit. B2
Vitamin B3
Vit. B3
Vitamin B5
Vit. B5
Vitamin B6
Vit. B6
Vitamin B12
Vit. B12
Vitamin K
Vit. K
Folate
Folate
167%
0%
70%
0%
63%
309%
168%
0%
556%
0%
0%
206%
6
100 g
300 g
1 tbsp - 16g 1 oz - 28.35g
Vitamin C
Vit. C
Vitamin D
Vit. D
Vitamin A
Vit. A
Vitamin E
Vit. E
Vitamin B1
Vit. B1
Vitamin B2
Vit. B2
Vitamin B3
Vit. B3
Vitamin B5
Vit. B5
Vitamin B6
Vit. B6
Vitamin B12
Vit. B12
Vitamin K
Vit. K
Folate
Folate
0%
44%
90%
38%
48%
143%
2.3%
210%
74%
2500%
1.5%
38%
All nutrients comparison - raw data values
Nutrient
DV% diff.
Vitamin B12
0µg
20µg
833%
Manganese
7.967mg
0.05mg
344%
Iron
32.3mg
11.88mg
255%
Cholesterol
0mg
588mg
196%
Vitamin B6
2.41mg
0.32mg
161%
Selenium
4.4µg
65.5µg
111%
Choline
490.9mg
89%
Calcium
1139mg
275mg
86%
Potassium
3020mg
181mg
84%
Vitamin B5
3.5mg
70%
Copper
0.677mg
0.11mg
63%
Sodium
62mg
1500mg
63%
Vitamin C
50mg
0mg
56%
Folate
274µg
50µg
56%
Vitamin B2
1.339mg
0.62mg
55%
Vitamin B3
8.95mg
0.12mg
55%
Fiber
7.4g
0g
30%
Zinc
3.9mg
0.95mg
27%
Polyunsaturated fat
3.698g
7.405g
25%
Fats
7.24g
17.9g
16%
Carbs
50.22g
4g
15%
Vitamin D*
0 IU
117 IU
15%
Vitamin D
0µg
2.9µg
15%
Vitamin E
1.89mg
13%
Magnesium
347mg
300mg
11%
Saturated fat
1.881g
4.06g
10%
Monounsaturated fat
0.474g
4.631g
10%
Vitamin A
210µg
271µg
7%
Phosphorus
313mg
356mg
6%
Vitamin B1
0.251mg
0.19mg
5%
Protein
22.77g
24.6g
4%
Calories
295kcal
264kcal
2%
Vitamin K
0.6µg
1%
Protein per 100 calories
7.7g
9.3g
N/A
Calories per 10 g protein
130kcal
107kcal
N/A
Weight per 100 calories
34g
38g
N/A
Unsaturated / Saturated Fat ratio
2.2
3
N/A
Net carbs
42.82g
4g
N/A
Tryptophan
0.323mg
0%
Threonine
1.263mg
0%
Isoleucine
1.035mg
0%
Leucine
2.133mg
0%
Lysine
1.834mg
0%
Methionine
0.646mg
0%
Phenylalanine
1.071mg
0%
Valine
1.263mg
0%
Histidine
0.649mg
0%
Omega-3 - EPA
0g
2.741g
N/A
Omega-3 - DHA
0g
3.8g
N/A
Omega-3 - DPA
0g
0.229g
N/A
Macronutrient Comparison
Macronutrient breakdown side-by-side comparison
2
23%
7%
50%
8%
12%
Protein:
22.77 g
Fats:
7.24 g
Carbs:
50.22 g
Water:
7.74 g
Other:
12.03 g
3
25%
18%
4%
48%
6%
Protein:
24.6 g
Fats:
17.9 g
Carbs:
4 g
Water:
47.5 g
Other:
6 g
Contains
more
Carbs Carbs
+1155.5%
Contains
more
Other Other
+100.5%
Contains
more
Fats Fats
+147.2%
Contains
more
Water Water
+513.7%
Fat Type Comparison
Fat type breakdown side-by-side comparison
1
31%
8%
61%
Saturated fat:
Sat. Fat
1.881 g
Monounsaturated fat:
Mono. Fat
0.474 g
Polyunsaturated fat:
Poly. Fat
3.698 g
2
25%
29%
46%
Saturated fat:
Sat. Fat
4.06 g
Monounsaturated fat:
Mono. Fat
4.631 g
Polyunsaturated fat:
Poly. Fat
7.405 g
Contains
less
Sat. Fat Saturated fat
-53.7%
Contains
more
Mono. Fat Monounsaturated fat
+877%
Contains
more
Poly. Fat Polyunsaturated fat
+100.2%