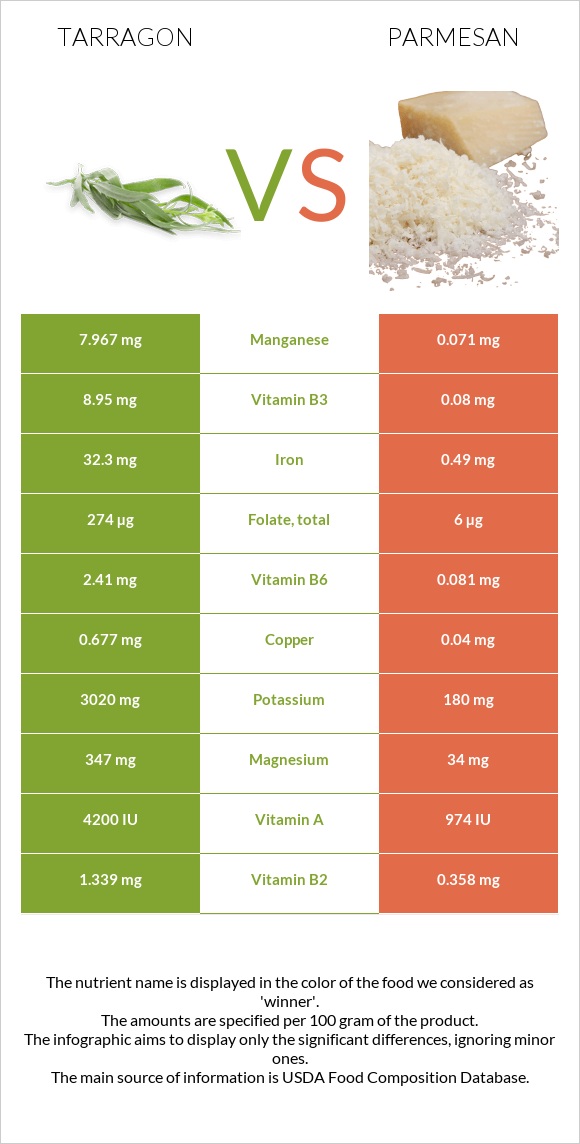
Summary of differences between tarragon and parmesan The amount of iron, manganese, vitamin B6, potassium, vitamin B2, magnesium, copper, and folate in tarragon is higher than in parmesan. Tarragon covers your daily need for iron, 398% more than parmesan. Tarragon contains 112 times more manganese than parmesan. While tarragon contains 7.967mg of manganese, parmesan contains only 0.071mg. The amount of saturated fat in tarragon is lower. These are the specific foods used in this comparison Spices, tarragon, dried and Cheese, parmesan, grated .
Infographic
Mineral Comparison
Mineral comparison score is based on the number of minerals by which one or the other food is richer. The "coverage" charts below show how much of the daily needs can be covered by 300 grams of the food.
7
100 g
300 g
0.25 tsp - 0.5g 1 tsp, ground - 1.6g 1 tbsp, leaves - 1.8g 1 tbsp, ground - 4.8g
Magnesium
Magnesium
Calcium
Calcium
Potassium
Potassium
Iron
Iron
Copper
Copper
Zinc
Zinc
Phosphorus
Phosphorus
Sodium
Sodium
Manganese
Manganese
Selenium
Selenium
248%
342%
266%
1211%
226%
106%
134%
8.1%
1039%
24%
2
100 g
300 g
1 tbsp - 5g 1 oz - 28.35g
Magnesium
Magnesium
Calcium
Calcium
Potassium
Potassium
Iron
Iron
Copper
Copper
Zinc
Zinc
Phosphorus
Phosphorus
Sodium
Sodium
Manganese
Manganese
Selenium
Selenium
24%
256%
16%
18%
13%
115%
269%
235%
9.3%
188%
Vitamin Comparison
Vitamin comparison score is based on the number of vitamins by which one or the other food is richer. The "coverage" charts below show how much of the daily needs can be covered by 300 grams of the food.
6
100 g
300 g
0.25 tsp - 0.5g 1 tsp, ground - 1.6g 1 tbsp, leaves - 1.8g 1 tbsp, ground - 4.8g
Vitamin C
Vit. C
Vitamin D
Vit. D
Vitamin A
Vit. A
Vitamin E
Vit. E
Vitamin B1
Vit. B1
Vitamin B2
Vit. B2
Vitamin B3
Vit. B3
Vitamin B5
Vit. B5
Vitamin B6
Vit. B6
Vitamin B12
Vit. B12
Vitamin K
Vit. K
Folate
Folate
167%
0%
70%
0%
63%
309%
168%
0%
556%
0%
0%
206%
6
100 g
300 g
1 tbsp - 5g 1 oz - 28.35g
Vitamin C
Vit. C
Vitamin D
Vit. D
Vitamin A
Vit. A
Vitamin E
Vit. E
Vitamin B1
Vit. B1
Vitamin B2
Vit. B2
Vitamin B3
Vit. B3
Vitamin B5
Vit. B5
Vitamin B6
Vit. B6
Vitamin B12
Vit. B12
Vitamin K
Vit. K
Folate
Folate
0%
7.5%
87%
11%
6.5%
83%
1.5%
27%
19%
175%
4.3%
4.5%
All nutrients comparison - raw data values
Nutrient
DV% diff.
Iron
32.3mg
0.49mg
398%
Manganese
7.967mg
0.071mg
343%
Vitamin B6
2.41mg
0.081mg
179%
Potassium
3020mg
180mg
84%
Sodium
62mg
1804mg
76%
Magnesium
347mg
34mg
75%
Vitamin B2
1.339mg
0.358mg
75%
Copper
0.677mg
0.04mg
71%
Folate
274µg
6µg
67%
Saturated fat
1.881g
15.371g
61%
Vitamin B12
0µg
1.4µg
58%
Vitamin C
50mg
0mg
56%
Selenium
4.4µg
34.4µg
55%
Vitamin B3
8.95mg
0.08mg
55%
Phosphorus
313mg
627mg
45%
Fats
7.24g
27.84g
32%
Fiber
7.4g
0g
30%
Cholesterol
0mg
86mg
29%
Calcium
1139mg
853mg
29%
Vitamin B1
0.251mg
0.026mg
19%
Monounsaturated fat
0.474g
7.13g
17%
Polyunsaturated fat
3.698g
1.386g
15%
Carbs
50.22g
13.91g
12%
Protein
22.77g
28.42g
11%
Vitamin B5
0.45mg
9%
Calories
295kcal
420kcal
6%
Vitamin A
210µg
262µg
6%
Vitamin E
0.53mg
4%
Vitamin D*
0 IU
21 IU
3%
Vitamin D
0µg
0.5µg
3%
Zinc
3.9mg
4.2mg
3%
Choline
14.1mg
3%
Vitamin K
1.7µg
1%
Protein per 100 calories
7.7g
6.8g
N/A
Calories per 10 g protein
130kcal
148kcal
N/A
Weight per 100 calories
34g
24g
N/A
Unsaturated / Saturated Fat ratio
2.2
0.55
N/A
Net carbs
42.82g
13.91g
N/A
Sugar
0.07g
N/A
Trans fat
0g
0.876g
N/A
Tryptophan
0.383mg
0%
Threonine
1.075mg
0%
Isoleucine
1.455mg
0%
Leucine
2.747mg
0%
Lysine
2.201mg
0%
Methionine
0.751mg
0%
Phenylalanine
1.538mg
0%
Valine
1.865mg
0%
Histidine
0.806mg
0%
Omega-3 - ALA
0.102g
N/A
Omega-3 - DPA
0g
0.015g
N/A
Omega-3 - Eicosatrienoic acid
0.002g
N/A
Omega-6 - Gamma-linoleic acid
0.002g
N/A
Omega-6 - Dihomo-gamma-linoleic acid
0.026g
N/A
Omega-6 - Eicosadienoic acid
0.006g
N/A
Omega-6 - Linoleic acid
0.87g
N/A
Macronutrient Comparison
Macronutrient breakdown side-by-side comparison
2
23%
7%
50%
8%
12%
Protein:
22.77 g
Fats:
7.24 g
Carbs:
50.22 g
Water:
7.74 g
Other:
12.03 g
3
28%
28%
14%
23%
7%
Protein:
28.42 g
Fats:
27.84 g
Carbs:
13.91 g
Water:
22.65 g
Other:
7.18 g
Contains
more
Carbs Carbs
+261%
Contains
more
Other Other
+67.5%
Contains
more
Protein Protein
+24.8%
Contains
more
Fats Fats
+284.5%
Contains
more
Water Water
+192.6%
Fat Type Comparison
Fat type breakdown side-by-side comparison
2
31%
8%
61%
Saturated fat:
Sat. Fat
1.881 g
Monounsaturated fat:
Mono. Fat
0.474 g
Polyunsaturated fat:
Poly. Fat
3.698 g
1
64%
30%
6%
Saturated fat:
Sat. Fat
15.371 g
Monounsaturated fat:
Mono. Fat
7.13 g
Polyunsaturated fat:
Poly. Fat
1.386 g
Contains
less
Sat. Fat Saturated fat
-87.8%
Contains
more
Poly. Fat Polyunsaturated fat
+166.8%
Contains
more
Mono. Fat Monounsaturated fat
+1404.2%