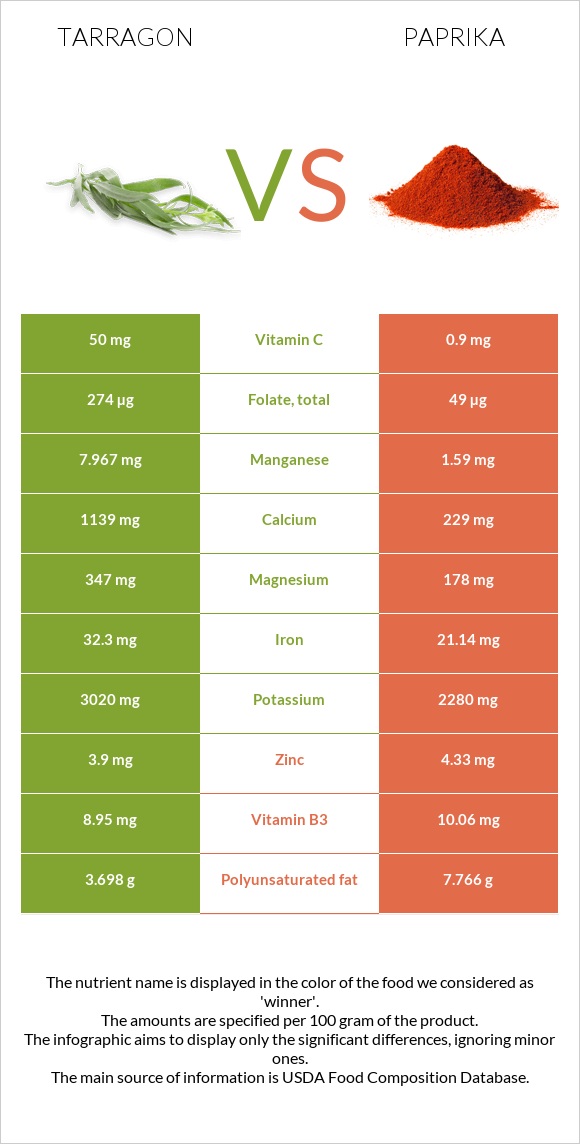
How are tarragon and paprika different? Tarragon is higher in manganese, iron, calcium, folate, vitamin C, magnesium, potassium, and vitamin B6; however, paprika is richer in vitamin A and fiber. Daily need coverage for vitamin A for paprika is 901% higher. Tarragon contains 56 times more vitamin C than paprika. While tarragon contains 50mg of vitamin C, paprika contains only 0.9mg. Spices, tarragon, dried and Spices, paprika are the varieties used in this article.
Infographic
Mineral Comparison
Mineral comparison score is based on the number of minerals by which one or the other food is richer. The "coverage" charts below show how much of the daily needs can be covered by 300 grams of the food.
5
100 g
300 g
0.25 tsp - 0.5g 1 tsp, ground - 1.6g 1 tbsp, leaves - 1.8g 1 tbsp, ground - 4.8g
Magnesium
Magnesium
Calcium
Calcium
Potassium
Potassium
Iron
Iron
Copper
Copper
Zinc
Zinc
Phosphorus
Phosphorus
Sodium
Sodium
Manganese
Manganese
Selenium
Selenium
248%
342%
266%
1211%
226%
106%
134%
8.1%
1039%
24%
2
100 g
300 g
0.25 tsp - 0.5g 1 tbsp - 6.8g
Magnesium
Magnesium
Calcium
Calcium
Potassium
Potassium
Iron
Iron
Copper
Copper
Zinc
Zinc
Phosphorus
Phosphorus
Sodium
Sodium
Manganese
Manganese
Selenium
Selenium
127%
69%
201%
793%
238%
118%
135%
8.9%
207%
34%
Vitamin Comparison
Vitamin comparison score is based on the number of vitamins by which one or the other food is richer. The "coverage" charts below show how much of the daily needs can be covered by 300 grams of the food.
3
100 g
300 g
0.25 tsp - 0.5g 1 tsp, ground - 1.6g 1 tbsp, leaves - 1.8g 1 tbsp, ground - 4.8g
Vitamin C
Vit. C
Vitamin D
Vit. D
Vitamin A
Vit. A
Vitamin E
Vit. E
Vitamin B1
Vit. B1
Vitamin B2
Vit. B2
Vitamin B3
Vit. B3
Vitamin B5
Vit. B5
Vitamin B6
Vit. B6
Vitamin B12
Vit. B12
Vitamin K
Vit. K
Folate
Folate
167%
0%
70%
0%
63%
309%
168%
0%
556%
0%
0%
206%
6
100 g
300 g
0.25 tsp - 0.5g 1 tbsp - 6.8g
Vitamin C
Vit. C
Vitamin D
Vit. D
Vitamin A
Vit. A
Vitamin E
Vit. E
Vitamin B1
Vit. B1
Vitamin B2
Vit. B2
Vitamin B3
Vit. B3
Vitamin B5
Vit. B5
Vitamin B6
Vit. B6
Vitamin B12
Vit. B12
Vitamin K
Vit. K
Folate
Folate
3%
0%
821%
582%
83%
284%
189%
151%
494%
0%
201%
37%
All nutrients comparison - raw data values
Nutrient
DV% diff.
Manganese
7.967mg
1.59mg
277%
Vitamin A
210µg
2463µg
250%
Vitamin E
29.1mg
194%
Iron
32.3mg
21.14mg
140%
Fiber
7.4g
34.9g
110%
Calcium
1139mg
229mg
91%
Vitamin K
80.3µg
67%
Folate
274µg
49µg
56%
Vitamin C
50mg
0.9mg
55%
Vitamin B5
2.51mg
50%
Magnesium
347mg
178mg
40%
Polyunsaturated fat
3.698g
7.766g
27%
Potassium
3020mg
2280mg
22%
Vitamin B6
2.41mg
2.141mg
21%
Protein
22.77g
14.14g
17%
Fats
7.24g
12.89g
9%
Choline
51.5mg
9%
Vitamin B2
1.339mg
1.23mg
8%
Fructose
6.71g
8%
Vitamin B1
0.251mg
0.33mg
7%
Vitamin B3
8.95mg
10.06mg
7%
Copper
0.677mg
0.713mg
4%
Zinc
3.9mg
4.33mg
4%
Selenium
4.4µg
6.3µg
3%
Monounsaturated fat
0.474g
1.695g
3%
Calories
295kcal
282kcal
1%
Carbs
50.22g
53.99g
1%
Saturated fat
1.881g
2.14g
1%
Protein per 100 calories
7.7g
5g
N/A
Calories per 10 g protein
130kcal
199kcal
N/A
Weight per 100 calories
34g
35g
N/A
Unsaturated / Saturated Fat ratio
2.2
4.4
N/A
Net carbs
42.82g
19.09g
N/A
Sugar
10.34g
N/A
Phosphorus
313mg
314mg
0%
Sodium
62mg
68mg
0%
Tryptophan
0.07mg
0%
Threonine
0.49mg
0%
Isoleucine
0.57mg
0%
Leucine
0.92mg
0%
Lysine
0.69mg
0%
Methionine
0.2mg
0%
Phenylalanine
0.61mg
0%
Valine
0.75mg
0%
Histidine
0.25mg
0%
Omega-3 - ALA
0.453g
N/A
Macronutrient Comparison
Macronutrient breakdown side-by-side comparison
2
23%
7%
50%
8%
12%
Protein:
22.77 g
Fats:
7.24 g
Carbs:
50.22 g
Water:
7.74 g
Other:
12.03 g
3
14%
13%
54%
11%
8%
Protein:
14.14 g
Fats:
12.89 g
Carbs:
53.99 g
Water:
11.24 g
Other:
7.74 g
Contains
more
Protein Protein
+61%
Contains
more
Other Other
+55.4%
Contains
more
Fats Fats
+78%
Contains
more
Water Water
+45.2%
Fat Type Comparison
Fat type breakdown side-by-side comparison
1
31%
8%
61%
Saturated fat:
Sat. Fat
1.881 g
Monounsaturated fat:
Mono. Fat
0.474 g
Polyunsaturated fat:
Poly. Fat
3.698 g
2
18%
15%
67%
Saturated fat:
Sat. Fat
2.14 g
Monounsaturated fat:
Mono. Fat
1.695 g
Polyunsaturated fat:
Poly. Fat
7.766 g
Contains
less
Sat. Fat Saturated fat
-12.1%
Contains
more
Mono. Fat Monounsaturated fat
+257.6%
Contains
more
Poly. Fat Polyunsaturated fat
+110%