Tilapia vs. Carp — Health Impact and Nutrition Comparison


Summary
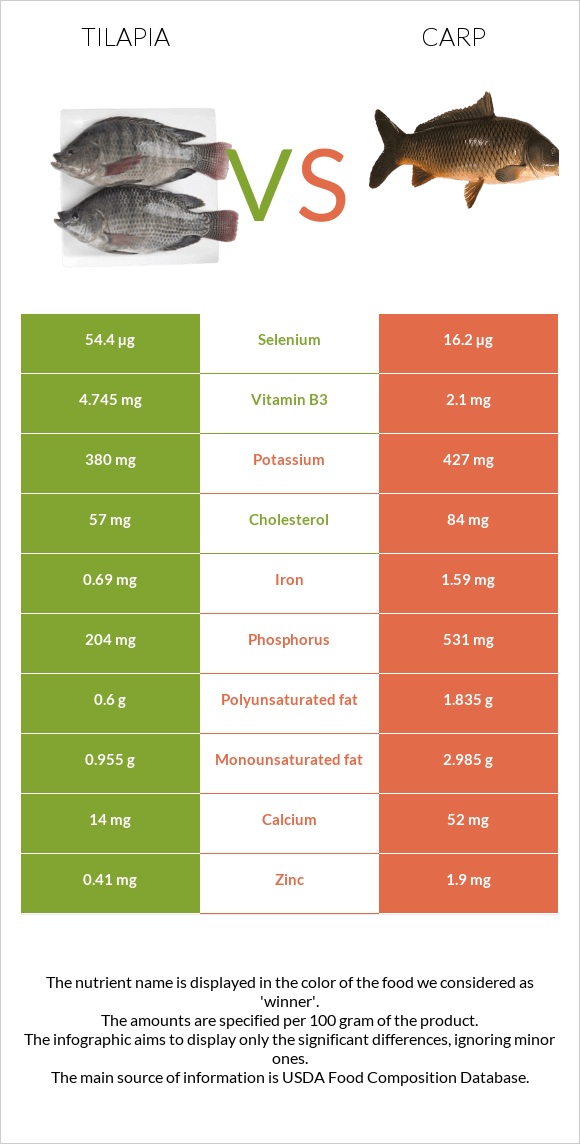
Tilapia has a milder taste, flakier texture, and is easier to cook. It is usually farmed and is a popular fish choice in North America and Europe. In contrast, carp has a stronger taste, oilier texture, and is more often wild-caught. It is popular in Asia and Eastern Europe.
Overall, carp is a fattier fish with a higher level of unsaturated fats but lower protein. Carp is significantly richer in vitamins, providing 3 times more vitamin B9, 2 times more vitamin B6, and more fat-soluble vitamins A, D, E, and K.
Carp also wins in the mineral category, containing nearly 5 times more zinc, 4 times more calcium, 3 times more phosphorus, and 2 times more iron. Tilapia, on the other hand, is 3 times higher in selenium.
Research on fish consumption and health finds that fish higher in polyunsaturated fats, such as omega-3 fatty acids, can lower the risk of cardiovascular disease and mortality rates. While tilapia and carp are lean white fish, carp is richer in omega-3 fats.
Introduction
Tilapia and carp are both types of white fish; however, some differences set these two apart. In this article, we will focus on these differences while also discussing some similarities.
Carp is more popular in Asia and Eastern Europe, unlike tilapia, which can be more easily found in North America and Europe. Tilapia is more often farmed, whereas carp is often wild-caught.
Taste and Use
Tilapia fits the description of white fish better as it has a milder taste and is usually flakier. In comparison, carp can have a stronger taste and an oilier texture due to the higher amount of fats. Wild carp varieties, especially, can have a more pronounced flavor.
Tilapia tends to be easier to cook and eat as it has fewer bones, which are easy to remove, while carp has smaller bones, which makes it difficult to debone.
Nutrition
The nutritional information below is presented for 100g servings of carp and tilapia cooked by dry heat. If you want to know about the nutrition of other serving sizes or cooking methods, you can find these options in the appropriate sections.
The average serving size for carp is 3 ounces or 85g, and the average serving size for tilapia is one fillet or 87g. One fillet of carp is larger, weighing 170g (1).
Macronutrients and Calories
Carp is slightly denser in terms of nutrition, consisting of 70% water and 30% nutrients, while tilapia is 72% water and 28% nutrients.
Macronutrient Comparison
Contains
more
ProteinProtein
+14.4%
Contains
more
FatsFats
+170.6%
Contains
more
OtherOther
+∞%
Calories
Carp is higher in calories, providing 34 more calories than tilapia per every 100g serving, mostly due to fats.
A 100-gram serving of carp and tilapia contains 162 and 128 calories, respectively.
Protein
Carp and tilapia have similar protein profiles, providing high amounts of all essential amino acids. That being said, tilapia is richer in proteins by 3.3g per 100g serving. Tilapia is somewhat higher in all the essential amino acids, except for histidine.
Fats
A 100g serving of carp contains 7.2g of fats, while the same serving size of tilapia has 2.7g. However, about 70% of the fat found in these fish is unsaturated.
Carp is 2.7 times higher in total fats; more particularly, it is 3 times higher in polyunsaturated fatty acids (PUFA) and monounsaturated fatty acids (MUFA) and only 1.5 times higher in saturated fats (SFA). Carp is richer in omega-3 and omega-6 fatty acids compared to tilapia.
Carp is also higher in cholesterol, containing 84mg per 100g serving, while this number for tilapia is 57mg.
Fat Type Comparison
Contains
less
Sat. FatSaturated fat
-32.3%
Contains
more
Mono. FatMonounsaturated fat
+212.6%
Contains
more
Poly. FatPolyunsaturated fat
+205.8%
Carbohydrates
Both tilapia and carp contain no carbohydrates.
Vitamins
Carp is overall richer in vitamins, providing 3 times more folate or vitamin B9 and about 2 times more vitamins B6, B1, and B5. Carp is a source of vitamin A and vitamin C, while tilapia lacks these nutrients. Carp also tends to be richer in fat-soluble vitamins, such as vitamins E, D, and K (2).
All that said, tilapia provides 2 times more vitamin B3 and is somewhat higher in vitamin B12.
Vitamin Comparison
Contains
more
Vitamin EVitamin E
+∞%
Contains
more
Vitamin DVitamin D
+∞%
Contains
more
Vitamin B3Vitamin B3
+126%
Contains
more
Vitamin B12Vitamin B12
+26.5%
Contains
more
Vitamin KVitamin K
+∞%
Contains
more
Vitamin CVitamin C
+∞%
Contains
more
Vitamin AVitamin A
+∞%
Contains
more
Vitamin B1Vitamin B1
+50.5%
Contains
more
Vitamin B5Vitamin B5
+31%
Contains
more
Vitamin B6Vitamin B6
+78%
Contains
more
FolateFolate
+183.3%
Minerals
Carp wins in the mineral category as well, providing nearly 5 times more zinc, 4 times more calcium, 3 times more phosphorus, and 2 times more iron. It is, in some measure, also higher in magnesium, potassium, and manganese.
On the other hand, tilapia is 3 times richer in selenium.
The sodium content of these fish depends greatly on the preparation method and the added salt in the cooking process. However, tilapia tends to be lower in sodium.
Mineral Comparison
Contains
less
SodiumSodium
-11.1%
Contains
more
SeleniumSelenium
+235.8%
Contains
more
MagnesiumMagnesium
+11.8%
Contains
more
CalciumCalcium
+271.4%
Contains
more
PotassiumPotassium
+12.4%
Contains
more
IronIron
+130.4%
Contains
more
ZincZinc
+363.4%
Contains
more
PhosphorusPhosphorus
+160.3%
Contains
more
ManganeseManganese
+35.1%
Glycemic Index
The glycemic index of foods with no carbohydrates, such as carp and tilapia, is considered to be 0.
Insulin Index
The insulin index is useful for foods with no carbohydrates, as it helps us to get an idea of how the given food affects our insulin levels. The insulin index value of tilapia and carp can be taken as 59, as that is the value assigned to white fish (3).
Health Impact
White fish, such as tilapia and carp, is considered a healthy choice for one’s diet in general. In this section, we will look into the research behind this claim.
Cardiovascular Health
One high-quality research found that fatty fish consumption can lower the risk of cardiovascular disease and overall mortality rates, while the same cannot be said about lean fish (4). Tilapia and carp are both considered lean white fish; however, carp is higher in fats, especially unsaturated fatty acids.
Overall, fish consumption has been studied to reduce triglyceride levels and increase high-density lipoprotein levels. These qualities are said to be due to the high levels of omega-3 fatty acids found in fish (5). As stated above, carp is higher in these. Other nutrients found in fish may also play a role, but there is less research surrounding this topic.
Diabetes
The research regarding the effect of fish consumption and the development of type 2 diabetes is mixed. Some research finds that unprocessed fatty and lean fish intake leads to a reduced risk of type 2 diabetes, while other studies do not find an association between the two (6, 7).
Mercury Content
According to the FDA, tilapia contains lower levels of mercury compared to carp. Tilapia falls in the category of “Best Choices” for fish low in mercury, while carp falls in the “Good Choices” category (8).
Based on the mercury content, 2 to 3 four-ounce servings of tilapia is allowed weekly during pregnancy and breastfeeding. For carp, only one serving a week is recommended.
Sources.
- https://fdc.nal.usda.gov/food-details/174185/measures
- https://fdc.nal.usda.gov/food-details/2706233/nutrients
- https://www.sciencedirect.com/science/article/pii/S2405457724001633
- https://pubmed.ncbi.nlm.nih.gov/35108375/
- https://www.researchgate.net/publication/240812944
- https://pmc.ncbi.nlm.nih.gov/articles/PMC2752921
- https://pmc.ncbi.nlm.nih.gov/articles/PMC2768220/
- https://www.fda.gov/food/consumers/advice-about-eating-fish#choice

Infographic
All nutrients comparison - raw data values
| Nutrient | |
|
DV% diff. |
| Selenium | 54.4µg | 16.2µg | 69% |
| Phosphorus | 204mg | 531mg | 47% |
| Vitamin D | 150 IU | 19% | |
| Vitamin D | 3.7µg | 19% | |
| Vitamin B3 | 4.745mg | 2.1mg | 17% |
| Vitamin B12 | 1.86µg | 1.47µg | 16% |
| Zinc | 0.41mg | 1.9mg | 14% |
| Iron | 0.69mg | 1.59mg | 11% |
| Cholesterol | 57mg | 84mg | 9% |
| Choline | 51.3mg | 9% | |
| Polyunsaturated fat | 0.6g | 1.835g | 8% |
| Protein | 26.15g | 22.86g | 7% |
| Fats | 2.65g | 7.17g | 7% |
| Vitamin B6 | 0.123mg | 0.219mg | 7% |
| Vitamin E | 0.79mg | 5% | |
| Monounsaturated fat | 0.955g | 2.985g | 5% |
| Calcium | 14mg | 52mg | 4% |
| Vitamin B1 | 0.093mg | 0.14mg | 4% |
| Vitamin B5 | 0.664mg | 0.87mg | 4% |
| Folate | 6µg | 17µg | 3% |
| Calories | 128kcal | 162kcal | 2% |
| Vitamin C | 0mg | 1.6mg | 2% |
| Saturated fat | 0.94g | 1.388g | 2% |
| Magnesium | 34mg | 38mg | 1% |
| Potassium | 380mg | 427mg | 1% |
| Vitamin A | 0µg | 10µg | 1% |
| Manganese | 0.037mg | 0.05mg | 1% |
| Vitamin K | 0.9µg | 1% | |
| Copper | 0.075mg | 0.073mg | 0% |
| Sodium | 56mg | 63mg | 0% |
| Vitamin B2 | 0.073mg | 0.07mg | 0% |
| Tryptophan | 0.265mg | 0.256mg | 0% |
| Threonine | 1.156mg | 1.002mg | 0% |
| Isoleucine | 1.22mg | 1.054mg | 0% |
| Leucine | 2.04mg | 1.858mg | 0% |
| Lysine | 2.315mg | 2.1mg | 0% |
| Methionine | 0.766mg | 0.677mg | 0% |
| Phenylalanine | 1.05mg | 0.893mg | 0% |
| Valine | 1.28mg | 1.178mg | 0% |
| Histidine | 0.585mg | 0.673mg | 0% |
| Omega-3 - EPA | 0.005g | 0.305g | N/A |
| Omega-3 - DHA | 0.13g | 0.146g | N/A |
| Omega-3 - ALA | 0.045g | N/A | |
| Omega-3 - DPA | 0.06g | 0.105g | N/A |
| Omega-6 - Eicosadienoic acid | 0.015g | N/A |
People also compare


References
All the values for which the sources are not specified explicitly are taken from FDA’s Food Central. The exact link to the food presented on this page can be found below.
- Tilapia - https://fdc.nal.usda.gov/fdc-app.html#/food-details/175177/nutrients
- Carp - https://fdc.nal.usda.gov/fdc-app.html#/food-details/174185/nutrients
All the Daily Values are presented for males aged 31-50, for 2000-calorie diets.