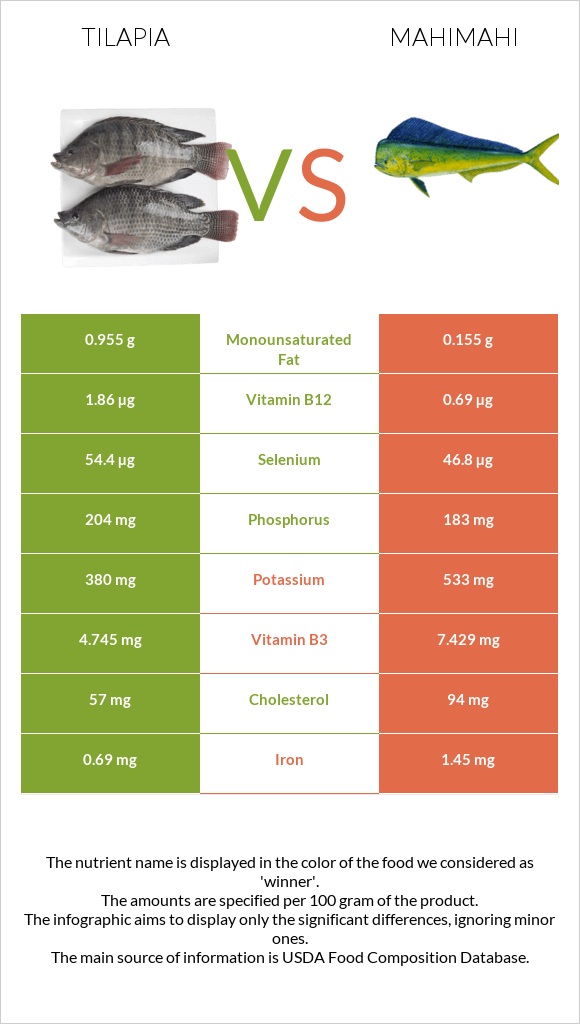
Tilapia vs. Mahimahi — Health Impact and Nutrition Comparison


Summary
Tilapia is higher in protein, fat, vitamin D, phosphorus, and selenium. It is also lower in sodium and cholesterol.
On the other hand, mahi mahi contains more calcium, potassium, vitamin B3, vitamin A, and fewer calories.
Introduction
Tilapia and mahi mahi are two of the most consumed fishes in the world. In this article, we will compare these foods, focusing on their nutritional composition and health impact and showing their actual differences.
Actual differences
Tilapia (1) is a freshwater fish from the Cichlidae family. This fish is usually widespread in the Nile River and the Middle East. Tilapia has a fishy, mild, and a bit sweet taste. Tilapia has a broader range of cooking methods: it is usually consumed in sealed, poached, steamed, grilled, raw, baked, or smoked forms. You can easily find tilapia in markets, in frozen or fresh form.
Mahi mahi (2), the dolphinfish or dorado fish, is a yellow or bright-green predatory fish primarily found in Hawaii. Mahi mahi has a non-fishy flavor compared to tilapia. It is usually fried with herbs, lemon, and spices. The fish lives in the Gulf of Mexico and the Caribbean Sea. However, it is sold and found worldwide.
Nutrition
Here we will discuss the macronutrient, mineral, and vitamin composition of raw tilapia and mahi mahi. Both of them do not provide any quantities of carbs.
Macronutrient Comparison
Contains
more
FatsFats
+194.4%
Contains
more
OtherOther
+∞%
Protein
Tilapia is higher in protein than mahi mahi. Per 100g serving, tilapia provides 26.2g of protein, while mahi mahi contains 23.7g of it.
Both contain many essential amino acids, such as lysine, histidine, and phenylalanine.
Fat
Tilapia is nearly three times higher in fats than mahi mahi. It is richer in both saturated and unsaturated fats. Tilapia is an excellent source of omega-6 fatty acids.
Surprisingly, mahi mahi is 37mg higher in cholesterol than tilapia.
Fat Type Comparison
Contains
more
Mono. FatMonounsaturated fat
+516.1%
Contains
more
Poly. FatPolyunsaturated fat
+184.4%
Contains
less
Sat. FatSaturated fat
-74.4%
Calories
Tilapia and mahi mahi are classified as low-calorie foods. Due to its higher protein and fat composition, tilapia provides more calories than mahi mahi. It has 19 more calories per 100g serving.
Minerals
Mahi mahi provides more zinc and iron than tilapia. Tilapia contains more phosphorus and copper. Tilapia is lower in sodium than mahi mahi. Mahi mahi is rich in mercury, while tilapia provides more selenium (3).
Check the mineral comparison chart below for a visual representation of the distribution of minerals.
Mineral Comparison
Contains
more
CopperCopper
+41.5%
Contains
more
PhosphorusPhosphorus
+11.5%
Contains
less
SodiumSodium
-50.4%
Contains
more
ManganeseManganese
+94.7%
Contains
more
SeleniumSelenium
+16.2%
Contains
more
MagnesiumMagnesium
+11.8%
Contains
more
CalciumCalcium
+35.7%
Contains
more
PotassiumPotassium
+40.3%
Contains
more
IronIron
+110.1%
Contains
more
ZincZinc
+43.9%
Vitamins
Tilapia is richer in vitamins B1 and B12. Mahi mahi contains vitamin A which is not present in tilapia. In contrast, mahi mahi lacks vitamin D, which is produced in tilapia.
Vitamin Comparison
Contains
more
Vitamin DVitamin D
+∞%
Contains
more
Vitamin EVitamin E
+∞%
Contains
more
Vitamin B1Vitamin B1
+304.3%
Contains
more
Vitamin B12Vitamin B12
+169.6%
Contains
more
Vitamin KVitamin K
+∞%
Contains
more
Vitamin AVitamin A
+∞%
Contains
more
Vitamin B2Vitamin B2
+16.4%
Contains
more
Vitamin B3Vitamin B3
+56.6%
Contains
more
Vitamin B5Vitamin B5
+30.3%
Contains
more
Vitamin B6Vitamin B6
+275.6%
Health impact
Cardiovascular health
Tilapia and mahi mahi consumption is connected to lower cardiovascular disease risk (4). This is due to omega-3 and omega-6 fatty acid composition. These two compounds are long-chain essential fatty acids that are not produced in the human organism. Hence we must get them with the food we eat. Research shows that the risk of heart disease increases when there is no balance between omega-6 and omega-3 fatty acid concentrations in the blood flow (5). Mahi mahi boosts omega-3 levels in the bloodstream of those with higher omega-6 levels (6).
Health risks
Mahi mahi is considered a food with moderate quantities of mercury. While this mineral is not harmful to healthy middle-aged persons, it can harm kids, teenagers, and pregnant women. (7). To minimize mercury poisoning, limit your fish intake.
While consuming tilapia, you should consider it is often fed with animal feces and farmed with toxic chemicals and banned techniques. It may contain dioxin, a potential carcinogen (8).
References
- https://fdc.nal.usda.gov/fdc-app.html#/food-details/175176/nutrients
- https://fdc.nal.usda.gov/fdc-app.html#/food-details/171959/nutrients
- https://www.ncbi.nlm.nih.gov/pmc/articles/PMC6553691/
- https://www.ncbi.nlm.nih.gov/pmc/articles/PMC7468748/
- https://pubmed.ncbi.nlm.nih.gov/34371930/
- https://pubmed.ncbi.nlm.nih.gov/23351633/
- https://www.ncbi.nlm.nih.gov/pmc/articles/PMC2954077/
- https://pubmed.ncbi.nlm.nih.gov/14623487/

Infographic
All nutrients comparison - raw data values
| Nutrient | |
|
DV% diff. |
| Vitamin B12 | 1.86µg | 0.69µg | 49% |
| Vitamin B6 | 0.123mg | 0.462mg | 26% |
| Vitamin D* | 150 IU | 19% | |
| Vitamin D | 3.7µg | 19% | |
| Vitamin B3 | 4.745mg | 7.429mg | 17% |
| Selenium | 54.4µg | 46.8µg | 14% |
| Cholesterol | 57mg | 94mg | 12% |
| Iron | 0.69mg | 1.45mg | 10% |
| Choline | 51.3mg | 9% | |
| Vitamin A | 0µg | 62µg | 7% |
| Vitamin B1 | 0.093mg | 0.023mg | 6% |
| Protein | 26.15g | 23.72g | 5% |
| Potassium | 380mg | 533mg | 5% |
| Vitamin E | 0.79mg | 5% | |
| Vitamin B5 | 0.664mg | 0.865mg | 4% |
| Fats | 2.65g | 0.9g | 3% |
| Phosphorus | 204mg | 183mg | 3% |
| Saturated fat | 0.94g | 0.241g | 3% |
| Polyunsaturated fat | 0.6g | 0.211g | 3% |
| Copper | 0.075mg | 0.053mg | 2% |
| Zinc | 0.41mg | 0.59mg | 2% |
| Sodium | 56mg | 113mg | 2% |
| Monounsaturated fat | 0.955g | 0.155g | 2% |
| Calories | 128kcal | 109kcal | 1% |
| Magnesium | 34mg | 38mg | 1% |
| Calcium | 14mg | 19mg | 1% |
| Manganese | 0.037mg | 0.019mg | 1% |
| Vitamin B2 | 0.073mg | 0.085mg | 1% |
| Vitamin K | 0.9µg | 1% | |
| Protein per 100 calories | 20g | 22g | N/A |
| Calories per 10 g protein | 49kcal | 46kcal | N/A |
| Weight per 100 calories | 78g | 92g | N/A |
| Unsaturated / Saturated Fat ratio | 1.7 | 1.5 | N/A |
| Folate | 6µg | 6µg | 0% |
| Tryptophan | 0.265mg | 0.266mg | 0% |
| Threonine | 1.156mg | 1.04mg | 0% |
| Isoleucine | 1.22mg | 1.093mg | 0% |
| Leucine | 2.04mg | 1.928mg | 0% |
| Lysine | 2.315mg | 2.178mg | 0% |
| Methionine | 0.766mg | 0.702mg | 0% |
| Phenylalanine | 1.05mg | 0.926mg | 0% |
| Valine | 1.28mg | 1.222mg | 0% |
| Histidine | 0.585mg | 0.698mg | 0% |
| Omega-3 - EPA | 0.005g | 0.026g | N/A |
| Omega-3 - DHA | 0.13g | 0.113g | N/A |
| Omega-3 - ALA | 0.045g | N/A | |
| Omega-3 - DPA | 0.06g | 0.012g | N/A |
| Omega-6 - Eicosadienoic acid | 0.015g | N/A |
People also compare


References
All the values for which the sources are not specified explicitly are taken from FDA’s Food Central. The exact link to the food presented on this page can be found below.
- Tilapia - https://fdc.nal.usda.gov/fdc-app.html#/food-details/175177/nutrients
- Mahimahi - https://fdc.nal.usda.gov/fdc-app.html#/food-details/171992/nutrients
All the Daily Values are presented for males aged 31-50, for 2000-calorie diets.