Tilapia vs. Perch — Health Impact and Nutrition Comparison


Summary
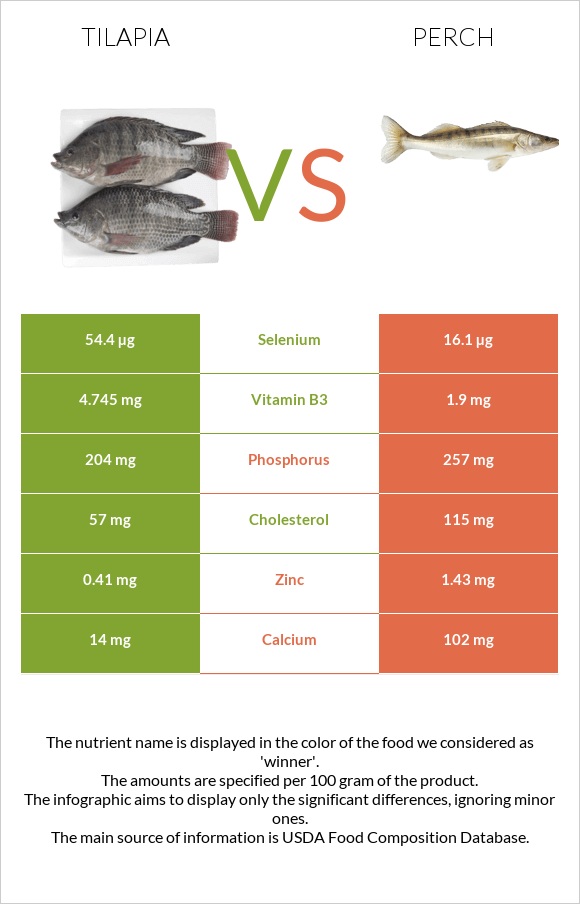
Tilapia contains twice the amount of fat perch provides, while perch contains around 2 times more cholesterol.
Tilapia is relatively richer in most vitamins, containing around 3.7µg of Vitamin D per 100-gram serving, while perch completely lack the vitamin. It also contains around 2 times more Vitamin B3. On the other hand, perch contains more minerals, specifically, around 24 times more manganese.
Introduction
This article compares two famous types of fish: perch and tilapia, focusing on their nutritional content and health impact.
What's the Actual Difference?
Tilapia is a freshwater fish belonging to the Cichlidae family, while perch is a common name for the fish groups that belong to the Percidae family.
Tilapia has a fishy, mild flavor, and perch has a sweet taste and firm, crumbly texture. Tilapia fishes have compressed bodies and long dorsal fins. The dorsal fin's leading edge is heavily spined. While perch's appearance varies greatly, they all have a slender body shape, two back fins, and one anal fin.
Both fish can be cooked in various ways, including grilled, baked, poached, or smoked.
Nutrition
The nutritional differences here are depicted for cooked perch and cooked tilapia.
The average serving size for both is usually one fillet, which is about 46 grams for perch and 87 grams for tilapia.
To make the comparison easier, we will be referring to 100-gram servings of each.
Macronutrients and Calories
As can be seen from the macronutrient composition charts below, both of these types of fish have similar distributions of macronutrients. They consist of around 72% water and 25% protein.
Macronutrient Comparison
Contains
more
FatsFats
+124.6%
Contains
more
OtherOther
+∞%
Calories
Both perch and tilapia are considered moderate-calorie foods.
Perch provides 117 calories per 100-gram serving, while tilapia provides 128 calories per same serving.
Fats
Perch and tilapia provide very little amount of fat; nevertheless, comparatively, tilapia contains twice the amount of fat perch provides.
Per 100-gram serving, perch contains 1.18 grams of fat, while tilapia contains 2.65 grams.
Cholesterol
Perch provides 2 times more cholesterol than tilapia, although both amounts are very small when put in the context of daily recommended intake.
Perch has 115mg of cholesterol per 100mg, while tilapia provides 57mg per 100g.
Protein
Both of these types of fish are great sources of protein.
The amounts of protein in perch and tilapia are almost equal: perch contains 24.86g of protein, while tilapia contains 26.15 grams per 100-gram serving.
Both fishes contain essential amino acids, such as lysine, histidine, and phenylalanine.
Vitamins
The predominant vitamins found in tilapia are Vitamin B12, Vitamin B5, Vitamin D, and Vitamin B3. The predominant vitamins in perch are Vitamin B12 and Vitamin B5.
Both contain similar amounts of Vitamin B12 and Vitamin B5, although the amounts in perch are slightly higher. Tilapia contains 3.7µg of Vitamin D per 100-gram serving, while perch completely lack the vitamin. Tilapia also contains around 2 times more Vitamin B3.
Moreover, while tilapia contains small amounts of Vitamin K and Vitamin E, perch completely lacks these vitamins. Conversely, when it comes to Vitamin A and Vitamin C, the situation is reversed, with perch containing small quantities of the vitamins while it remains entirely absent in tilapia.
Vitamin Comparison
Contains
more
Vitamin EVitamin E
+∞%
Contains
more
Vitamin DVitamin D
+∞%
Contains
more
Vitamin B1Vitamin B1
+16.3%
Contains
more
Vitamin B3Vitamin B3
+149.7%
Contains
more
Vitamin KVitamin K
+∞%
Contains
more
Vitamin CVitamin C
+∞%
Contains
more
Vitamin AVitamin A
+∞%
Contains
more
Vitamin B2Vitamin B2
+64.4%
Contains
more
Vitamin B5Vitamin B5
+31%
Contains
more
Vitamin B6Vitamin B6
+13.8%
Contains
more
Vitamin B12Vitamin B12
+18.3%
Minerals
Perch is relatively richer in minerals than tilapia. Specifically, it contains around 24 times more manganese, as well as around 7 times more calcium and 3 times more zinc.
Perch also contains more phosphorus, copper, and iron. On the other hand, tilapia contains around 3 times more selenium.
Mineral Comparison
Contains
less
SodiumSodium
-29.1%
Contains
more
SeleniumSelenium
+237.9%
Contains
more
MagnesiumMagnesium
+11.8%
Contains
more
CalciumCalcium
+628.6%
Contains
more
IronIron
+68.1%
Contains
more
CopperCopper
+156%
Contains
more
ZincZinc
+248.8%
Contains
more
PhosphorusPhosphorus
+26%
Contains
more
ManganeseManganese
+2332.4%
Glycemic Index
The glycemic index is a rating system used for foods containing carbohydrates. As both perch and tilapia contain no carbohydrates, their glycemic index is 0, which means their consumption has minimal or no effect on blood sugar levels.
Acidity
One way to understand the acidity of foods is through their potential renal acid load (PRAL) value, which shows how much acid or base the given food produces inside the organism.
Based on our calculations, the PRAL values of perch and tilapia are 12.2 and 11.3, respectively, which means both values are acidic.
Health Impact
Health Benefits
Both tilapia and perch are high in omega-3 and omega-6 fatty acids. These two compounds can help improve cardiovascular health, eye health, and the immune system (1). According to research, the risk of heart disease increases when the concentrations of omega-6 and omega-3 fatty acids in the blood flow are out of balance (2).
According to one study, omega-3 fatty acids may reduce inflammation, improving dry eye symptoms and abnormal vessel growth in diabetic retinopathy patients (3). Another study found that bioactive proteins, peptides, or protein hydrolysates from omega-3-rich fish have immunomodulatory properties (4).
Side Effects
Purines found in perch can cause kidney stones. A high purine intake results in increased uric acid production, which concentration facilitates the formation of uric acid stones (5).
As mentioned in this article, heart disease risks may increase when the concentrations of omega-6 and omega-3 fatty acids in the blood flow are out of balance. The bad news is that tilapia has a higher omega-6 to omega-3 ratio than other fish, which may increase the risk of inflammatory diseases such as heart disease (6).
References

Infographic
All nutrients comparison - raw data values
| Nutrient | |
|
DV% diff. |
| Selenium | 54.4µg | 16.1µg | 70% |
| Manganese | 0.037mg | 0.9mg | 38% |
| Cholesterol | 57mg | 115mg | 19% |
| Vitamin D | 150 IU | 19% | |
| Vitamin D | 3.7µg | 19% | |
| Vitamin B3 | 4.745mg | 1.9mg | 18% |
| Vitamin B12 | 1.86µg | 2.2µg | 14% |
| Copper | 0.075mg | 0.192mg | 13% |
| Calcium | 14mg | 102mg | 9% |
| Zinc | 0.41mg | 1.43mg | 9% |
| Choline | 51.3mg | 9% | |
| Phosphorus | 204mg | 257mg | 8% |
| Iron | 0.69mg | 1.16mg | 6% |
| Vitamin E | 0.79mg | 5% | |
| Vitamin B2 | 0.073mg | 0.12mg | 4% |
| Vitamin B5 | 0.664mg | 0.87mg | 4% |
| Protein | 26.15g | 24.86g | 3% |
| Saturated fat | 0.94g | 0.237g | 3% |
| Fats | 2.65g | 1.18g | 2% |
| Vitamin C | 0mg | 1.7mg | 2% |
| Monounsaturated fat | 0.955g | 0.195g | 2% |
| Calories | 128kcal | 117kcal | 1% |
| Magnesium | 34mg | 38mg | 1% |
| Potassium | 380mg | 344mg | 1% |
| Sodium | 56mg | 79mg | 1% |
| Vitamin A | 0µg | 10µg | 1% |
| Vitamin B1 | 0.093mg | 0.08mg | 1% |
| Vitamin B6 | 0.123mg | 0.14mg | 1% |
| Vitamin K | 0.9µg | 1% | |
| Polyunsaturated fat | 0.6g | 0.472g | 1% |
| Folate | 6µg | 6µg | 0% |
| Tryptophan | 0.265mg | 0.278mg | 0% |
| Threonine | 1.156mg | 1.09mg | 0% |
| Isoleucine | 1.22mg | 1.145mg | 0% |
| Leucine | 2.04mg | 2.02mg | 0% |
| Lysine | 2.315mg | 2.283mg | 0% |
| Methionine | 0.766mg | 0.736mg | 0% |
| Phenylalanine | 1.05mg | 0.97mg | 0% |
| Valine | 1.28mg | 1.281mg | 0% |
| Histidine | 0.585mg | 0.732mg | 0% |
| Omega-3 - EPA | 0.005g | 0.101g | N/A |
| Omega-3 - DHA | 0.13g | 0.223g | N/A |
| Omega-3 - ALA | 0.045g | N/A | |
| Omega-3 - DPA | 0.06g | 0.036g | N/A |
| Omega-6 - Eicosadienoic acid | 0.015g | N/A |
Fat Type Comparison
| Contains more Mono. FatMonounsaturated fat | +389.7% |
| Contains more Poly. FatPolyunsaturated fat | +27.1% |
| Contains less Sat. FatSaturated fat | -74.8% |
People also compare


References
All the values for which the sources are not specified explicitly are taken from FDA’s Food Central. The exact link to the food presented on this page can be found below.
- Tilapia - https://fdc.nal.usda.gov/fdc-app.html#/food-details/175177/nutrients
- Perch - https://fdc.nal.usda.gov/fdc-app.html#/food-details/173679/nutrients
All the Daily Values are presented for males aged 31-50, for 2000-calorie diets.