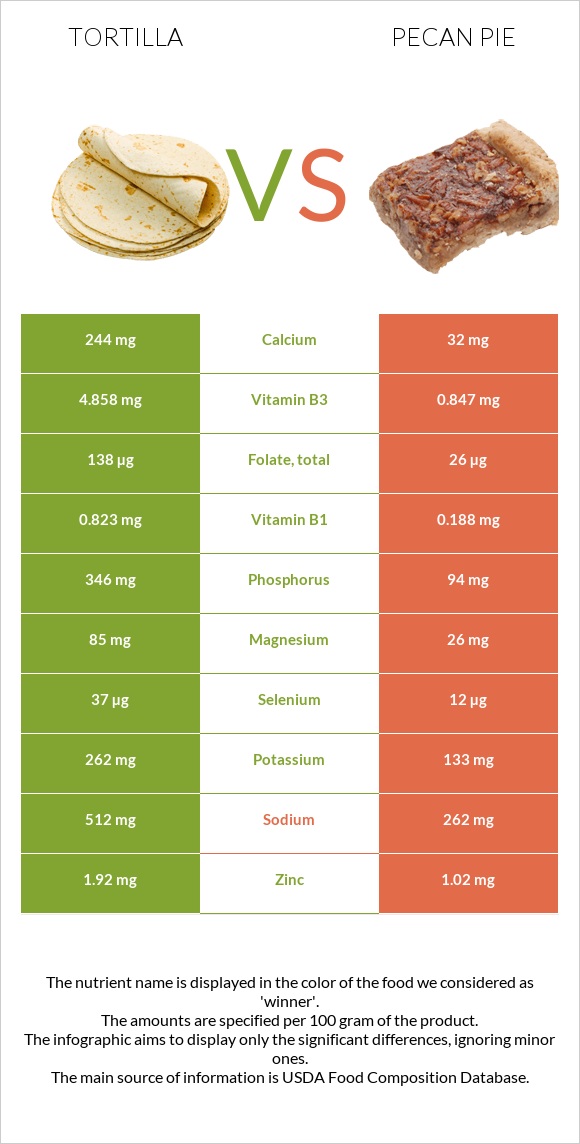
Significant differences between tortillas and pecan pie The amount of vitamin B1, selenium, phosphorus, folate, vitamin B3, calcium, vitamin B6, iron, and magnesium in tortillas is higher than in pecan pie. Tortillas cover your daily vitamin B1 needs 53% more than pecan pie. Pecan pie has 8 times less calcium than tortillas. Tortillas have 244mg of calcium, while pecan pie has 32mg. Specific food types used in this comparison are Tortillas, ready-to-bake or -fry, whole wheat and Pie, pecan, prepared from recipe .
Infographic
Mineral Comparison
Mineral comparison score is based on the number of minerals by which one or the other food is richer. The "coverage" charts below show how much of the daily needs can be covered by 300 grams of the food.
8
100 g
300 g
1 tortilla 1 serving - 41g
Magnesium
Magnesium
Calcium
Calcium
Potassium
Potassium
Iron
Iron
Copper
Copper
Zinc
Zinc
Phosphorus
Phosphorus
Sodium
Sodium
Manganese
Manganese
Selenium
Selenium
61%
73%
23%
99%
89%
52%
148%
67%
0%
202%
2
100 g
300 g
1 oz - 28.35g 1 piece (1/8 of 9" dia) - 122g
Magnesium
Magnesium
Calcium
Calcium
Potassium
Potassium
Iron
Iron
Copper
Copper
Zinc
Zinc
Phosphorus
Phosphorus
Sodium
Sodium
Manganese
Manganese
Selenium
Selenium
19%
9.6%
12%
56%
70%
28%
40%
34%
93%
65%
Vitamin Comparison
Vitamin comparison score is based on the number of vitamins by which one or the other food is richer. The "coverage" charts below show how much of the daily needs can be covered by 300 grams of the food.
7
100 g
300 g
1 tortilla 1 serving - 41g
Vitamin C
Vit. C
Vitamin D
Vit. D
Vitamin A
Vit. A
Vitamin E
Vit. E
Vitamin B1
Vit. B1
Vitamin B2
Vit. B2
Vitamin B3
Vit. B3
Vitamin B5
Vit. B5
Vitamin B6
Vit. B6
Vitamin B12
Vit. B12
Vitamin K
Vit. K
Folate
Folate
0%
0%
0%
18%
206%
67%
91%
0%
72%
0%
11%
104%
4
100 g
300 g
1 oz - 28.35g 1 piece (1/8 of 9" dia) - 122g
Vitamin C
Vit. C
Vitamin D
Vit. D
Vitamin A
Vit. A
Vitamin E
Vit. E
Vitamin B1
Vit. B1
Vitamin B2
Vit. B2
Vitamin B3
Vit. B3
Vitamin B5
Vit. B5
Vitamin B6
Vit. B6
Vitamin B12
Vit. B12
Vitamin K
Vit. K
Folate
Folate
0.67%
0%
27%
0%
47%
42%
16%
29%
14%
21%
0%
20%
All nutrients comparison - raw data values
Nutrient
DV% diff.
Vitamin B1
0.823mg
0.188mg
53%
Selenium
37µg
12µg
45%
Fiber
9.8g
39%
Phosphorus
346mg
94mg
36%
Manganese
0.712mg
31%
Polyunsaturated fat
0.992g
5.71g
31%
Cholesterol
0mg
87mg
29%
Folate
138µg
26µg
28%
Vitamin B3
4.858mg
0.847mg
25%
Calcium
244mg
32mg
21%
Monounsaturated fat
3.062g
11.181g
20%
Fats
9.76g
22.2g
19%
Vitamin B6
0.312mg
0.06mg
19%
Magnesium
85mg
26mg
14%
Iron
2.63mg
1.48mg
14%
Sodium
512mg
262mg
11%
Protein
9.76g
4.9g
10%
Vitamin B5
0.479mg
10%
Vitamin A
0µg
82µg
9%
Zinc
1.92mg
1.02mg
8%
Vitamin B2
0.289mg
0.18mg
8%
Vitamin B12
0µg
0.17µg
7%
Copper
0.266mg
0.211mg
6%
Vitamin E
0.9mg
6%
Calories
310kcal
412kcal
5%
Potassium
262mg
133mg
4%
Vitamin K
4.5µg
4%
Choline
20mg
4%
Saturated fat
4.878g
3.989g
4%
Carbs
45.89g
52.2g
2%
Protein per 100 calories
3.1g
1.2g
N/A
Calories per 10 g protein
318kcal
841kcal
N/A
Weight per 100 calories
32g
24g
N/A
Unsaturated / Saturated Fat ratio
0.83
4.2
N/A
Vitamin C
0mg
0.2mg
0%
Net carbs
36.09g
52.2g
N/A
Sugar
2.44g
N/A
Tryptophan
0.129mg
0.069mg
0%
Threonine
0.312mg
0.189mg
0%
Isoleucine
0.353mg
0.223mg
0%
Leucine
0.671mg
0.372mg
0%
Lysine
0.37mg
0.248mg
0%
Methionine
0.163mg
0.125mg
0%
Phenylalanine
0.488mg
0.25mg
0%
Valine
0.444mg
0.255mg
0%
Histidine
0.255mg
0.116mg
0%
Omega-3 - EPA
0g
0.001g
N/A
Omega-3 - DHA
0g
0.008g
N/A
Macronutrient Comparison
Macronutrient breakdown side-by-side comparison
3
10%
10%
46%
30%
4%
Protein:
9.76 g
Fats:
9.76 g
Carbs:
45.89 g
Water:
30.15 g
Other:
4.44 g
2
5%
22%
52%
20%
Protein:
4.9 g
Fats:
22.2 g
Carbs:
52.2 g
Water:
19.5 g
Other:
1.2 g
Contains
more
Protein Protein
+99.2%
Contains
more
Water Water
+54.6%
Contains
more
Other Other
+270%
Contains
more
Fats Fats
+127.5%
Contains
more
Carbs Carbs
+13.8%
Fat Type Comparison
Fat type breakdown side-by-side comparison
0
55%
34%
11%
Saturated fat:
Sat. Fat
4.878 g
Monounsaturated fat:
Mono. Fat
3.062 g
Polyunsaturated fat:
Poly. Fat
0.992 g
3
19%
54%
27%
Saturated fat:
Sat. Fat
3.989 g
Monounsaturated fat:
Mono. Fat
11.181 g
Polyunsaturated fat:
Poly. Fat
5.71 g
Contains
less
Sat. Fat Saturated fat
-18.2%
Contains
more
Mono. Fat Monounsaturated fat
+265.2%
Contains
more
Poly. Fat Polyunsaturated fat
+475.6%