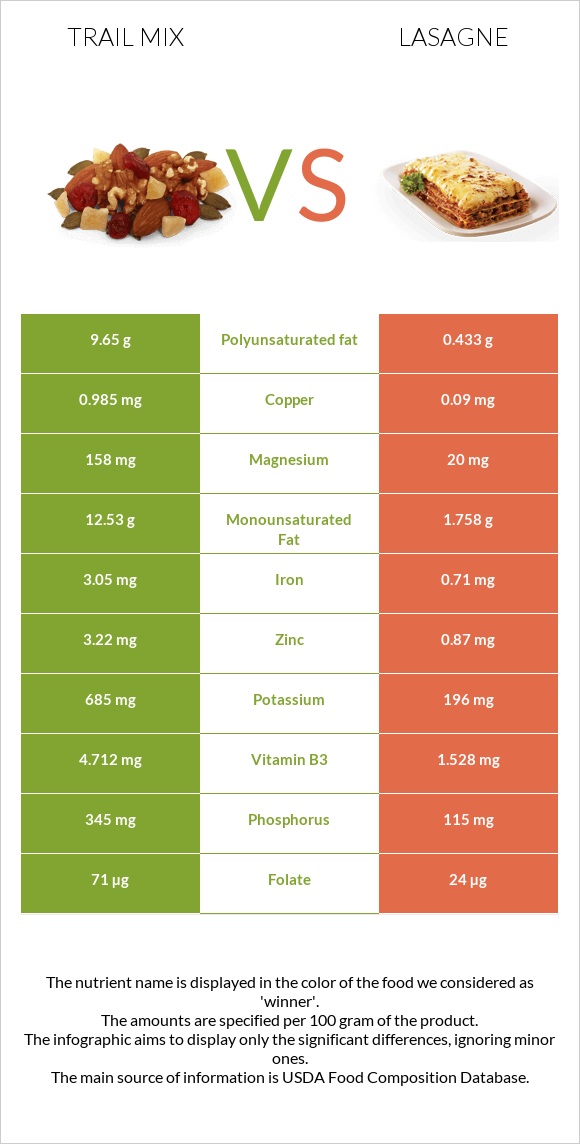
What are the main differences between trail mix and lasagne? Trail mix has more copper, manganese, phosphorus, magnesium, vitamin B1, iron, zinc, vitamin B3, and potassium than lasagne. Trail mix's daily need coverage for copper is 99% higher. Lasagne has 8 times less magnesium than trail mix. Trail mix has 158mg of magnesium, while lasagne has 20mg. Lasagne is lower in saturated fat. Lasagne has a higher glycemic index (28) than trail mix (15). We used Snacks, trail mix, regular and Lasagna with meat sauce, frozen, prepared types in this comparison.
Infographic
Mineral Comparison
Mineral comparison score is based on the number of minerals by which one or the other food is richer. The "coverage" charts below show how much of the daily needs can be covered by 300 grams of the food.
8
100 g
300 g
1 oz - 28.35g 1.5 oz - 42g 1 cup - 150g
Magnesium
Magnesium
Calcium
Calcium
Potassium
Potassium
Iron
Iron
Copper
Copper
Zinc
Zinc
Phosphorus
Phosphorus
Sodium
Sodium
Manganese
Manganese
Selenium
Selenium
113%
23%
60%
114%
328%
88%
148%
30%
135%
0%
2
100 g
300 g
1 piece corner - 114g 1 piece side - 123g 1 piece center - 255g
Magnesium
Magnesium
Calcium
Calcium
Potassium
Potassium
Iron
Iron
Copper
Copper
Zinc
Zinc
Phosphorus
Phosphorus
Sodium
Sodium
Manganese
Manganese
Selenium
Selenium
14%
26%
17%
27%
30%
24%
49%
49%
25%
87%
Vitamin Comparison
Vitamin comparison score is based on the number of vitamins by which one or the other food is richer. The "coverage" charts below show how much of the daily needs can be covered by 300 grams of the food.
6
100 g
300 g
1 oz - 28.35g 1.5 oz - 42g 1 cup - 150g
Vitamin C
Vit. C
Vitamin D
Vit. D
Vitamin A
Vit. A
Vitamin E
Vit. E
Vitamin B1
Vit. B1
Vitamin B2
Vit. B2
Vitamin B3
Vit. B3
Vitamin B5
Vit. B5
Vitamin B6
Vit. B6
Vitamin B12
Vit. B12
Vitamin K
Vit. K
Folate
Folate
4.7%
0%
0.33%
0%
116%
46%
88%
54%
69%
0%
0%
53%
5
100 g
300 g
1 piece corner - 114g 1 piece side - 123g 1 piece center - 255g
Vitamin C
Vit. C
Vitamin D
Vit. D
Vitamin A
Vit. A
Vitamin E
Vit. E
Vitamin B1
Vit. B1
Vitamin B2
Vit. B2
Vitamin B3
Vit. B3
Vitamin B5
Vit. B5
Vitamin B6
Vit. B6
Vitamin B12
Vit. B12
Vitamin K
Vit. K
Folate
Folate
8.3%
0%
14%
17%
18%
17%
29%
19%
28%
41%
18%
18%
All nutrients comparison - raw data values
Nutrient
DV% diff.
Copper
0.985mg
0.09mg
99%
Polyunsaturated fat
9.65g
0.433g
61%
Fats
29.4g
4.92g
38%
Manganese
1.034mg
0.193mg
37%
Magnesium
158mg
20mg
33%
Phosphorus
345mg
115mg
33%
Vitamin B1
0.462mg
0.07mg
33%
Iron
3.05mg
0.71mg
29%
Selenium
15.9µg
29%
Monounsaturated fat
12.53g
1.758g
27%
Zinc
3.22mg
0.87mg
21%
Vitamin B3
4.712mg
1.528mg
20%
Calories
462kcal
135kcal
16%
Saturated fat
5.55g
2.348g
15%
Potassium
685mg
196mg
14%
Vitamin B6
0.298mg
0.122mg
14%
Vitamin B12
0µg
0.33µg
14%
Protein
13.8g
7.28g
13%
Folate
71µg
24µg
12%
Vitamin B5
0.895mg
0.323mg
11%
Carbs
44.9g
15.36g
10%
Vitamin B2
0.198mg
0.074mg
10%
Fiber
1.7g
7%
Cholesterol
0mg
17mg
6%
Sodium
229mg
373mg
6%
Vitamin E
0.85mg
6%
Vitamin K
7µg
6%
Starch
9.83g
4%
Vitamin A
1µg
41µg
4%
Choline
23.2mg
4%
Vitamin C
1.4mg
2.5mg
1%
Calcium
78mg
88mg
1%
Fructose
1.04g
1%
Protein per 100 calories
3g
5.4g
N/A
Calories per 10 g protein
335kcal
185kcal
N/A
Weight per 100 calories
22g
74g
N/A
Unsaturated / Saturated Fat ratio
4
0.93
N/A
Net carbs
44.9g
13.66g
N/A
Vitamin D*
1 IU
0%
Sugar
3.11g
N/A
Trans fat
0.196g
N/A
Tryptophan
0.166mg
0.085mg
0%
Threonine
0.482mg
0.219mg
0%
Isoleucine
0.515mg
0.224mg
0%
Leucine
0.89mg
0.578mg
0%
Lysine
0.515mg
0.486mg
0%
Methionine
0.202mg
0.164mg
0%
Phenylalanine
0.658mg
0.329mg
0%
Valine
0.658mg
0.285mg
0%
Histidine
0.357mg
0.183mg
0%
Omega-3 - EPA
0.001g
N/A
Omega-3 - ALA
0.026g
N/A
Omega-3 - DPA
0.003g
N/A
Omega-6 - Dihomo-gamma-linoleic acid
0.006g
N/A
Omega-6 - Eicosadienoic acid
0.005g
N/A
Omega-6 - Linoleic acid
0.322g
N/A
Macronutrient Comparison
Macronutrient breakdown side-by-side comparison
4
14%
29%
45%
9%
3%
Protein:
13.8 g
Fats:
29.4 g
Carbs:
44.9 g
Water:
9.2 g
Other:
2.7 g
1
7%
5%
15%
71%
Protein:
7.28 g
Fats:
4.92 g
Carbs:
15.36 g
Water:
70.87 g
Other:
1.57 g
Contains
more
Protein Protein
+89.6%
Contains
more
Fats Fats
+497.6%
Contains
more
Carbs Carbs
+192.3%
Contains
more
Other Other
+72%
Contains
more
Water Water
+670.3%
Fat Type Comparison
Fat type breakdown side-by-side comparison
2
20%
45%
35%
Saturated fat:
Sat. Fat
5.55 g
Monounsaturated fat:
Mono. Fat
12.53 g
Polyunsaturated fat:
Poly. Fat
9.65 g
1
52%
39%
10%
Saturated fat:
Sat. Fat
2.348 g
Monounsaturated fat:
Mono. Fat
1.758 g
Polyunsaturated fat:
Poly. Fat
0.433 g
Contains
more
Mono. Fat Monounsaturated fat
+612.7%
Contains
more
Poly. Fat Polyunsaturated fat
+2128.6%
Contains
less
Sat. Fat Saturated fat
-57.7%